Statistics show when which documents have been processed with which pipeline and whether errors occurred.
Click the Statistics tab to open the statistics of all pipelines.
Prerequisites
To view the Statistics, you have to be assigned to the Manager role or higher.
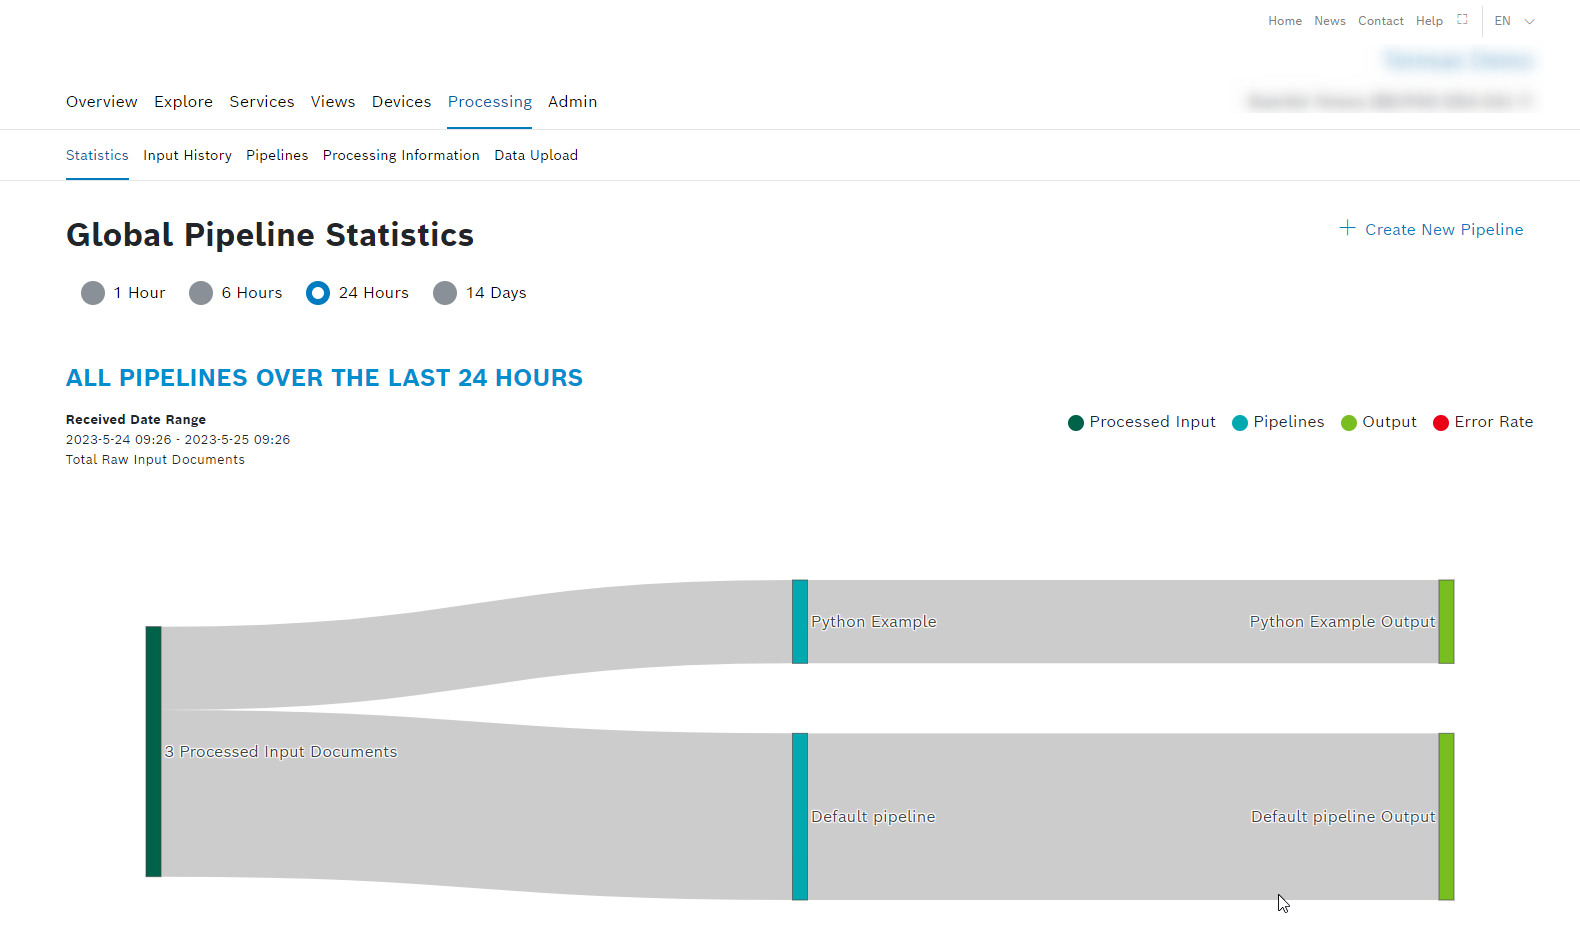
Legend
- Processed Input
Displays the number of processed input documents - Pipelines
Displays which pipeline has been used for processing - Output
Displays the collection to which the processed data has been stored - Error Rate
Displays how many errors have occurred while processing
General functions
Filtering the statistics
Proceed as follows
In the Global Pipelines Statistics section, select the time frame for which the statistics shall be displayed.
Viewing the raw input documents
Proceed as follows
Underneath Received Date Range, click the <number> Total Raw Input Documents link to view the input documents in the Input History.
→ The input history entries for the input documents are displayed in the Input History.
Creating a pipeline
Refer to the Creating a pipeline.