The Data Browser offers the possibility to view and browse all data of a project as simple as possible. Therefore, the processed data and the Thing history data can be displayed as a collapsible JSON tree view when opening the Data Browser. Furthermore, the data can be displayed as plain text or in a table.
Since no own aggregation queries can be expressed here, the Data Browser represents the entry point for viewing the data of a project as easily as possible.
Proceed as follows
- Click the Data Browser menu item.
→ The Data Browser is displayed. The Processed Data collection is selected by default and shows the processed data.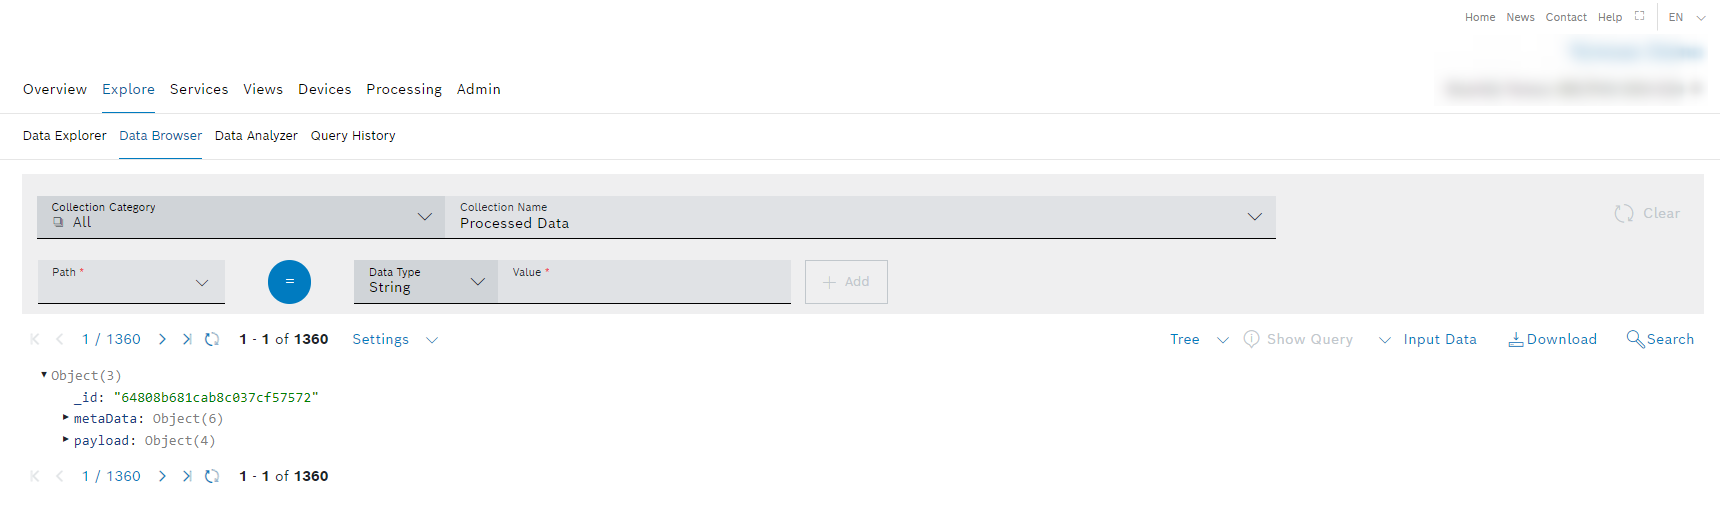
- Click the Collection drop-down list to select another collection, e.g., Thing History or Calendar Events.
Prerequisites
To execute the following actions, you have to be assigned to the User role or higher.
General functions
Filtering the Data Browser
The Data Browser provides a simple search function with which you can easily filter your data.
Proceed as follows
- In the Path drop-down list, select a path which you want to search through.
- Click the blue operator selector button to select an operator:
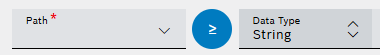
→ The drop-down list opens, containing available operators to select from, e.g.,Exists,Contains,Equals,Greater than, orLess or equal to, etc. In the Data Type drop-down list, select a data type which matches your data type of the path.
An incorrect data type selection might lead to unexpected results.
- In the Value field, enter any value you want to search for.
- Click the Add button to add this filter parameter.
→ The filter parameter is added. - Click the Search button to execute the filter parameter.
→ The query is executed. It can be extended with further filter parameters. All created filter parameters can be connected with logical operators, such as AND and/or OR functions. - Add further filter parameters as described in steps 1 to 5, as desired.
→ The Compound Logic Editor is displayed. - Click the button between the filter parameters to switch the connection from an AND to an OR - and vice versa.
- Click the Search button to execute the filter parameter.
→ The filter parameter is executed.
The Compound Logic Editor can also be extended by using the keyboard, e.g., by adding parentheses.

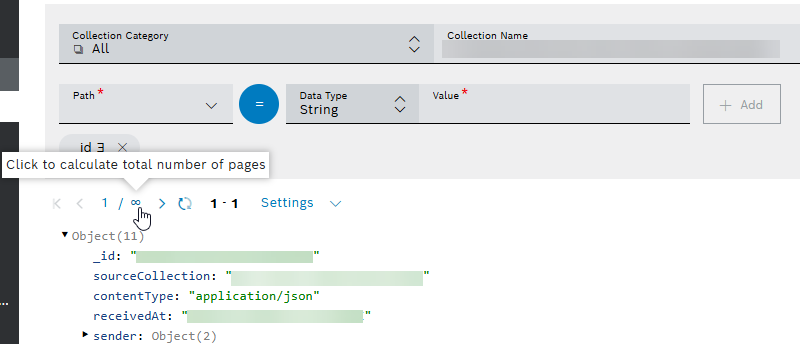
If you want to know the number of documents from the search result, click the infinity sign and the total number of pages will be displayed instead:
Paging
Proceed as follows
Use the ![]() and
and ![]() icons to go back a page or forward.
icons to go back a page or forward.
Use the ![]() and
and ![]() icons to jump to either the first page or the last page of the displayed data.
icons to jump to either the first page or the last page of the displayed data.
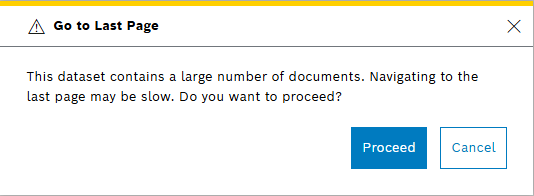
When the number of documents exceeds 10 000, and you still want to navigate to the last one, a warning message appears:
Refreshing the entries
Proceed as follows
Click the refresh icon![]() to refresh the entries.
to refresh the entries.
Limiting the number of displayed entries
Proceed as follows
- Click the Settings drop-down list.
- Select the number of processed data entries to be displayed per page.
→ The number of displayed entries per page is adjusted accordingly.
Single view of a data set:
{ "_id": "123", "_class": "sample.class.1", "metaData": { "key": 1 }, "payload": { "key": "value" }}Aggregated view of all data sets:
[ { "_id": "123", "_class": "sample.class.1", "metaData": { "key": 1 }, "payload": { "key": "value" } },{ "_id": "456", "_class": "sample.class.2", "metaData": { "key": 2 }, "payload": { "key": "value" } },{ "_id": "789", "_class": "sample.class.3", "metaData": { "key": 3 }, "payload": { "key": "value" } }]Defining the layout
Proceed as follows
- Click the Tree drop-down list to adjust the layout option.
- Select a layout option.
→ The layout is adjusted.
Displaying the input data
Click the Input Data button and select the ID of which you want to display the input data.
→ The input data is displayed under Processing > Input History.
Downloading the entries
- Click the Download button to download the entry.
Open or save the file to the desired location.
→ The processed data has been downloaded.
Searching the processed data
Use the Search button to search the processed data.
Two examples on how to work with the Thing history are provided in the Data Explorer chapter: