Deprecated: Data ingestion and visualization
There are many ways to ingest device data in Bosch IoT Insights. One way is to use a free plan of the Bosch IoT Device Management. This tutorial explains - as a first step - how you connect the service package with your project. Using an API development platform, we will send device data to Bosch IoT Insights via the Bosch IoT Things' HTTP API. In a last step, we will create a Value widget that shows the received data.
The example device will be an engine with a front and a rear temperature sensor. We will simulate how the temperature of the two sensors changes.
Provided material:
The content of the Data Ingestion and Visualization tutorial is also available as a video here.
This chapter details the following topics:
Connecting Bosch IoT Device Management with Bosch IoT Insights
Adjusting the provided collection in the API development tool
Checking whether device data has been received and processed
Booking Bosch IoT Device Management
Bosch IoT Device Management is a service package which supports the scalable and secure ingestion of large volumes of sensor and asset data, and also the remote control of your assets. The service package serves as the instance to create the digital twin of the engine.
Proceed as follows
Open your Bosch IoT Suite account.
Click the New Subscription button to add the Bosch IoT Suite for Asset Communication service package.
Select Bosch IoT Device Management.
Activate the Free Plan - Frankfurt (EU-1) - AWS checkbox.
In the Instance Name field, enter a name for the instance.
Click the Subscribe button.
→ The details of the subscription are displayed.Click the Subscribe button to book the free plan.
→ The subscription is being provisioned. It may take a while until your booking is active. Optionally, refresh the page.
Connecting Bosch IoT Device Management with Bosch IoT Insights
As a next step, a connection between Bosch IoT Device Management and your Bosch IoT Insights project has to be established.
Proceed as follows
In the Service Subscriptions overview page, click Go to Developer Console.
→ The Suite UI is displayed.Open the Connections entry in the left navigation.
In case it is not there, use the search, and click the star icon to pin it to your navigation bar.
→ The Connections page is displayed. Your instance is pre-configured with two connections, to allow all messages to be routed and processed at various service layers.Click the Add button to create a connection to Insights.
→ The Create a new connection dialog is displayed.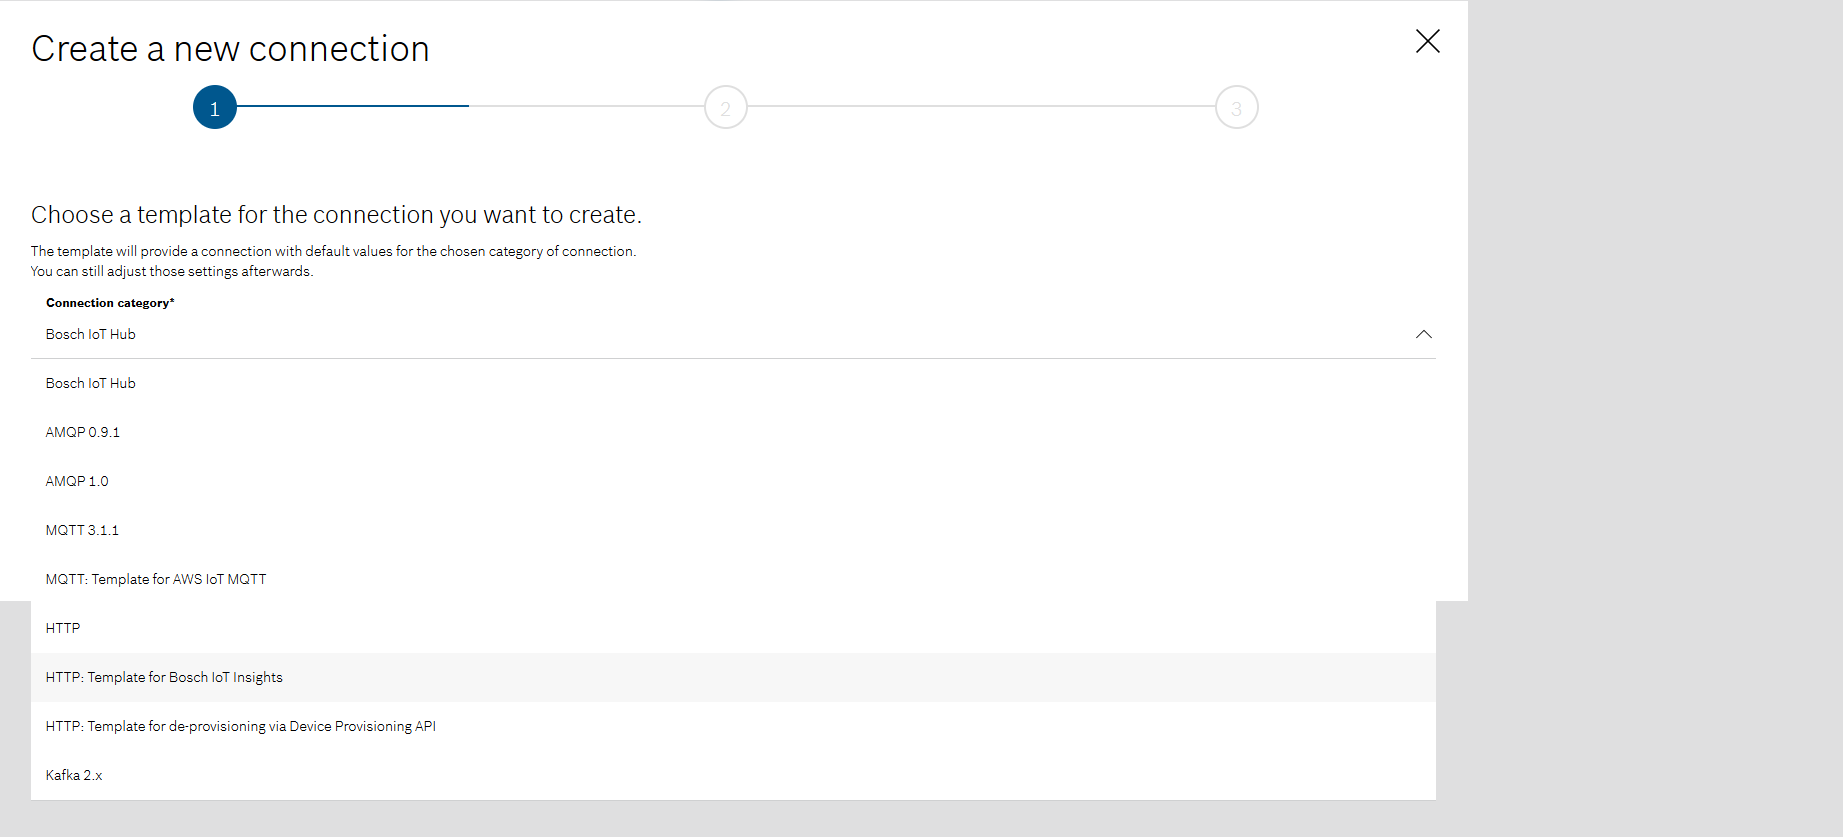
Use the drop down and choose HTTP: Template for Bosch IoT Insights.
In the Connection name field, enter a name for the connection.
Click the Continue button.
In the Bosch IoT Insights project ID from binding credentials field, enter the ID of your project.
You can find the Project ID in the binding credentials of your subscription. The Project ID is also visible in the URL of your project.
In the Bosch IoT Insights username field, enter the username of the API user that you created in the Creating an API user in Bosch IoT Insights section.
In the Bosch IoT Insights password field, enter the password of the API user that you created in the Creating an API user in Bosch IoT Insights section.
Click the Continue button.
In the Authorization subject field, enter insights.
The authorization subject is required to authorize the data transfer from the Device Management instance to Bosch IoT Insights.
After the connection has been set up, it will be visible in section Targets.This subject needs to be set in the policy later on.
Click the Continue button.
→ The connection details are displayed.Click the Test connection button to ensure that the connection is working fine.
Click the Create button to create the connection.
Creating an API user in Bosch IoT Insights
To establish the connection between Bosch IoT Device Management and your Bosch IoT Insights project, the credentials of an API user are required. In Bosch IoT Insights, an API user serves as a data provider.
Proceed as follows
Open your Bosch IoT Insights project.
Open the Admin > Users tab.
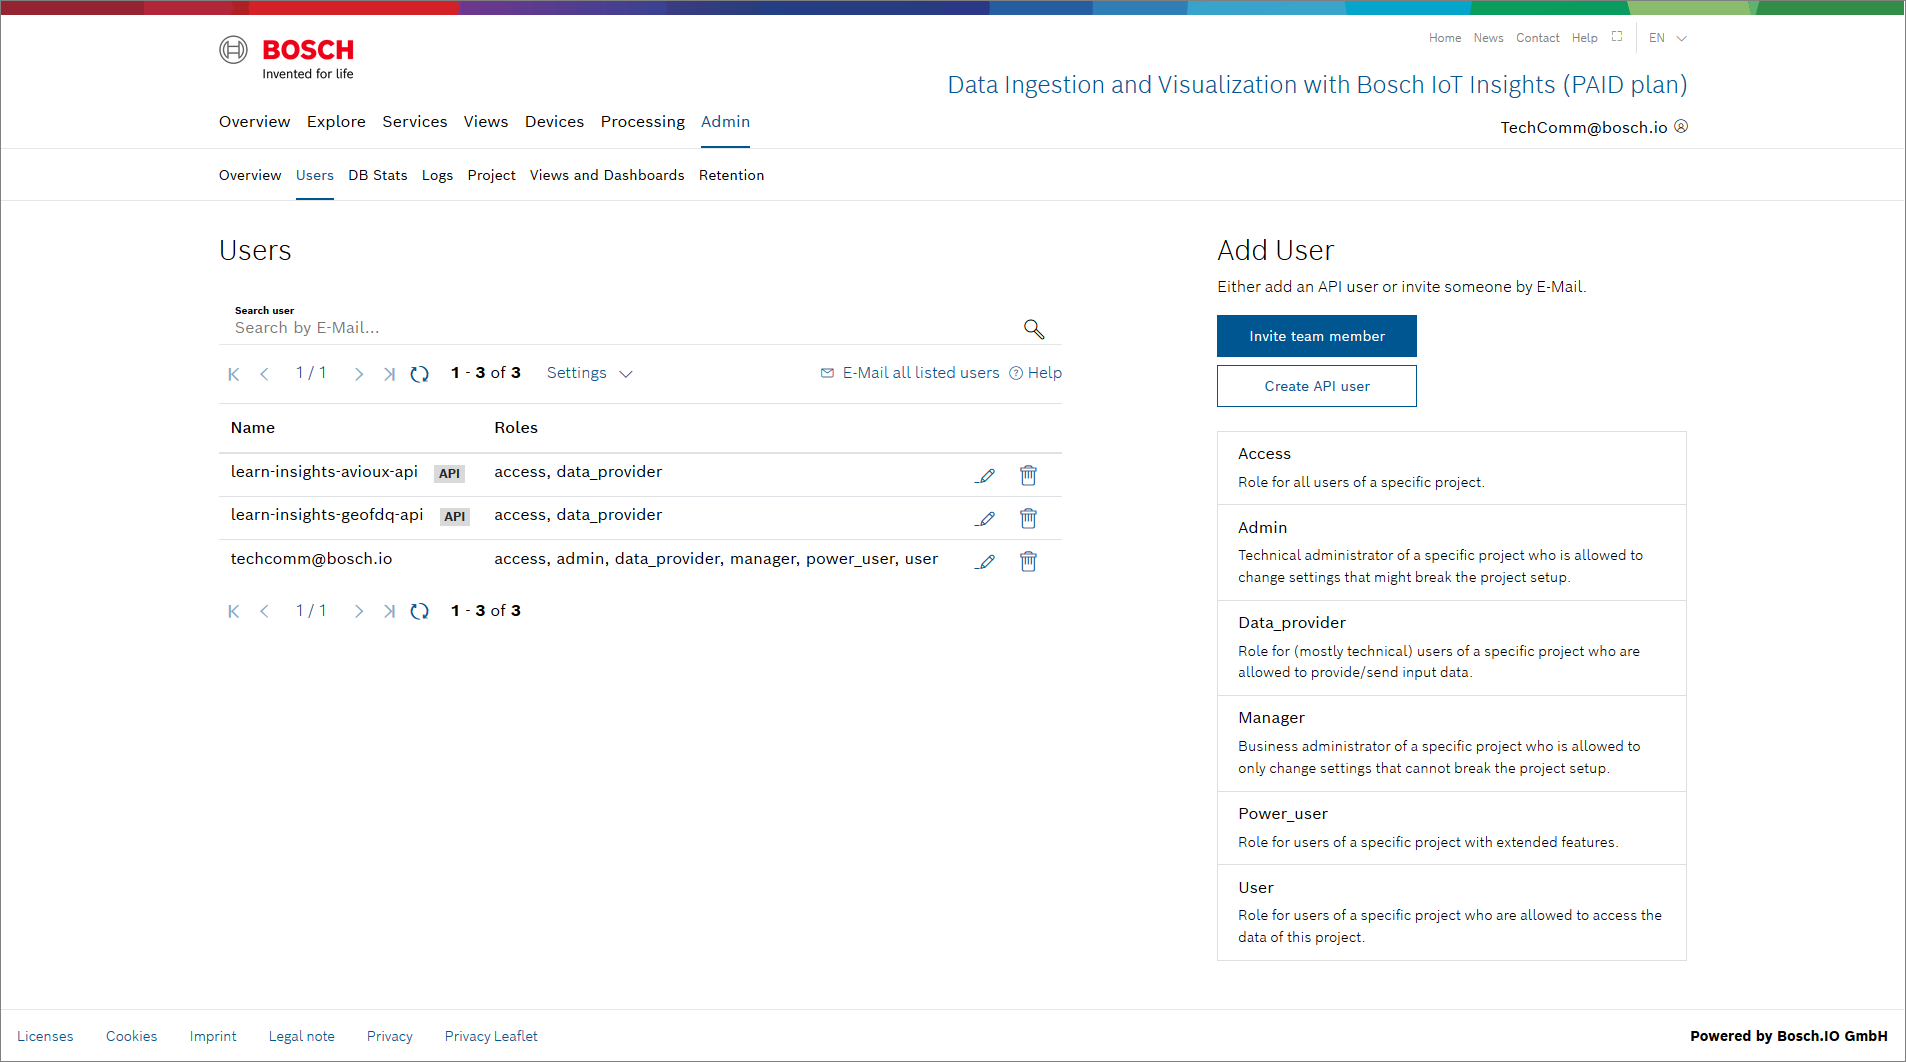
Click the Create API user button to add an API user.
→ The credentials are displayed in the Create API User dialog.The dialog provides the credentials for the API user to log in on API level. It is highly recommended to take a note of the credentials as they cannot be read out again.
Creating a namespace
The next step is to create a unique namespace in Bosch IoT Device Management. A namespace is used to separate things from different solution spaces from each other.
Proceed as follows
Starting from your Service Subscriptions page click Go to Developer Console item of your Device Management booking.
The Developer Console shows up.
Open the Namespace entry in the left navigation.

Click the plus icon to add a namespace.
Enter a namespace name in the field.
The namespace can be anything, as long as it conforms to the reverse domain name notation, e.g. example.dm, as in our case.
However, it needs to be unique, i.e. you cannot register the exact same namespace for multiple instances.The search index fields are set to the defaults which are most convenient for Bosch IoT Device Management to work properly.
More search index fields can be added later if needed.
The required fields are the minimum necessary and cannot be deactivated.
Confirm with Save.
Adjusting the provided collection in the API development tool
To send data to your Bosch IoT Insights project, we have provided a collection that consists of GET and PUT requests with which the Thing will be created, the Thing policy updated, and the data of the Thing modified. We also provided two requests that you can use to verify the creation of the Thing and the update of the policy.
In this section, the provided variables located in the URL and in the authorization tab need to be set. To set the values for the authorization variables, an OAuth2 client has to be created in your Bosch IoT Suite account, refer to the Creating an OAuth2 client section.
For our tutorial, we used Postman as an API development tool. Of course, you can use any other tool to execute the following steps.
Proceed as follows
Download the provided collection.
Open Postman.
Click the Import button and select the downloaded collection.
Click the View more actions icon of the collection and select Edit.
→ The EDIT COLLECTION dialog is displayed.Open the Variables tab.
→ All variables provided in the collection are listed. The value for the things_endpoint has already been provided.The Things Endpoint can be found in the Access Credentials of your subscription under Bosch IoT Things.
In the CURRENT VALUE field of the namespace variable, paste the namespace you just created.
Open the Authorization tab.
Some of the following fields may already be pre-filled and can be skipped.
In the TYPE drop-down list, select OAuth 2.0.
In the Token Name field of the Configure New Token section, enter a name for the token.
In the Grant Type drop-down list, select Client Credentials.
In the Access Token URL, enter the access token URL.
The Access Token URL can be found in the list of your OAuth2 Clients. Click the Use button. Scroll down to the Java Example with Spring Security OAuth2 Boot section and copy the Access Token URi from the second box.
Open the Variables tab to enter values for the Client ID, Client Secret, and the Scope.
In the CURRENT VALUE field of the oauth2_clientId variable, paste the Client ID of the OAuth2 client you just created.
In the CURRENT VALUE field of the oauth2_clientSecret variable, paste the Client Secret of the OAuth2 client you just created.
In the CURRENT VALUE field of the oauth2_scope variable, paste the scope of the OAuth2 client you just created.
Open the Authorization tab again.
In the Client Authentication drop-down list, select Send client credentials in body.
Click the Get New Access Token button to receive a new access token.
Click the Use Token button.
Click the Update button.
→ All changes made in the Authorization tab and the Variables tab have been saved.
Creating an OAuth2 client
To send any of the requests, the Bosch IoT Things HTTP API needs to be authorized. Therefore, OAuth 2.0 is used.
Proceed as follows
Open your Bosch IoT Suite account.
Open the OAuth2 Clients tab.
Click the New OAuth2 Client button.
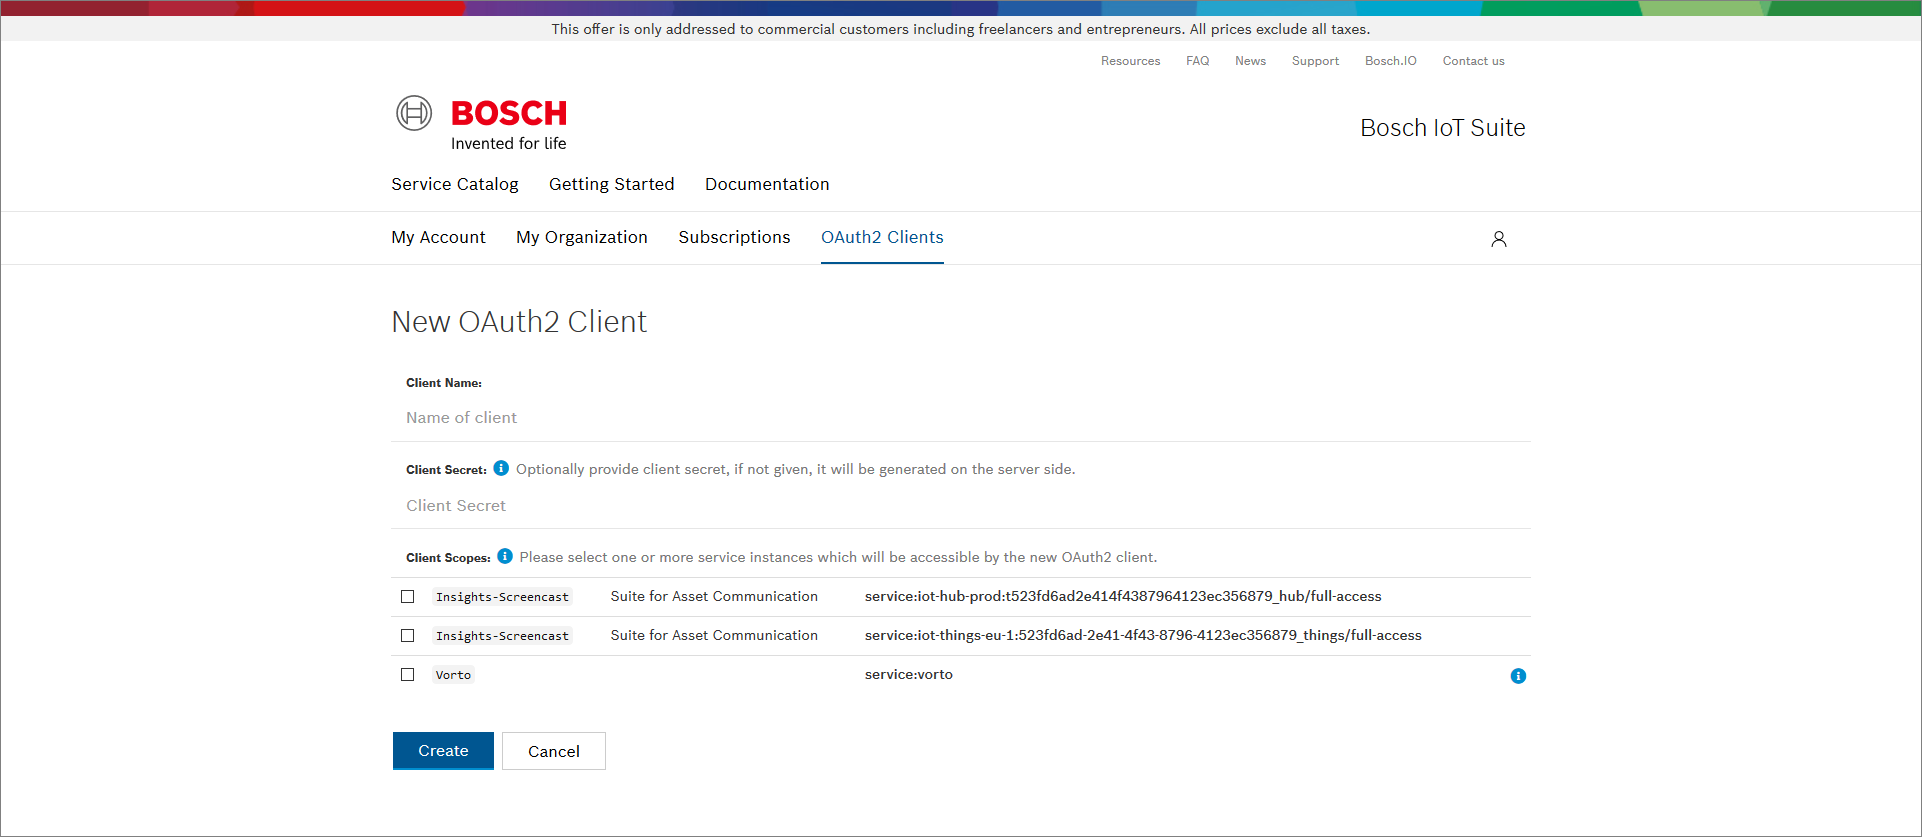
In the Client Name field, enter a client name.
For the client scope, select the service instance with _things/full-access at the end.
Click the Create button.
→ The OAuth2 Client Details are displayed.Click the Refresh button to have the Client ID and the Client Secret displayed.
→ The OAuth2 Client has been created.
Creating the digital twin of the engine
After the settings have been adjusted, the digital twin of the engine can be created in Postman.
Proceed as follows
Open the Create an engine in IoT Things PUT request.
Click the Send button.
→ The 201 Created HTTP status code has been returned and the digital twin created. The response also contains the policy which is always created for a Thing. The policy manages the access to things.
Optional: Verifying the creation of the Thing's digital twin
Optionally, you can verify whether the digital twin of the engine has been created.
Proceed as follows
Open the OPTIONAL: Verify the thing GET request.
Click the Send button.
→ The 200 OK HTTP status code has been returned which confirms that the Thing's digital twin has been created.
Adjusting the Thing policy
As a next step, the policy has to be adjusted to allow Bosch IoT Insights to read values from the Thing. Therefore, the authorization subject is required that was created when establishing the connection between Bosch IoT Device Management and Bosch IoT Insights.
Proceed as follows
Open the Update the thing policy PUT request.
The INSIGHTS entry at the end of the URL means that the request will create a new entry labeled Insights with the content prepared in the body.
Replace the authorization_subject parameter with the authorization subject.
You can find the authorization subject in the Connections UI, refer to the note below step 11 in the Connecting Bosch IoT Device Management with Bosch IoT Insights section.
Click the Send button.
→ The 201 Created HTTP status code has been returned and the policy adjusted.
Optional: Verifying the Thing policy
Optionally, you can verify the Thing policy.
Proceed as follows
Open the OPTIONAL: Verify the policy GET request.
Click the Send button.
→ The 200 OK HTTP status code has been returned which confirms that the Thing's policy is correct.
Sending device data to Bosch IoT Insights
Now that the Thing has been created and the policy adjusted, data can be sent to your Bosch IoT Insights project. The request body shows the front sensor and the rear sensor of the Thing as well as the values that shall be sent. In the Pre-Request Script, values have been provided which will be sent randomly to your project.
Proceed as follows
Open the Modify the temperatures PUT request.
Click the Send button.
→ The 204 Created HTTP status code has been returned and values sent to the Bosch IoT Insights project.
Checking whether device data has been received and processed
The next step is to check whether your Bosch IoT Insights project has received and processed the sent temperature values.
Proceed as follows
Open your Bosch IoT Insights project.
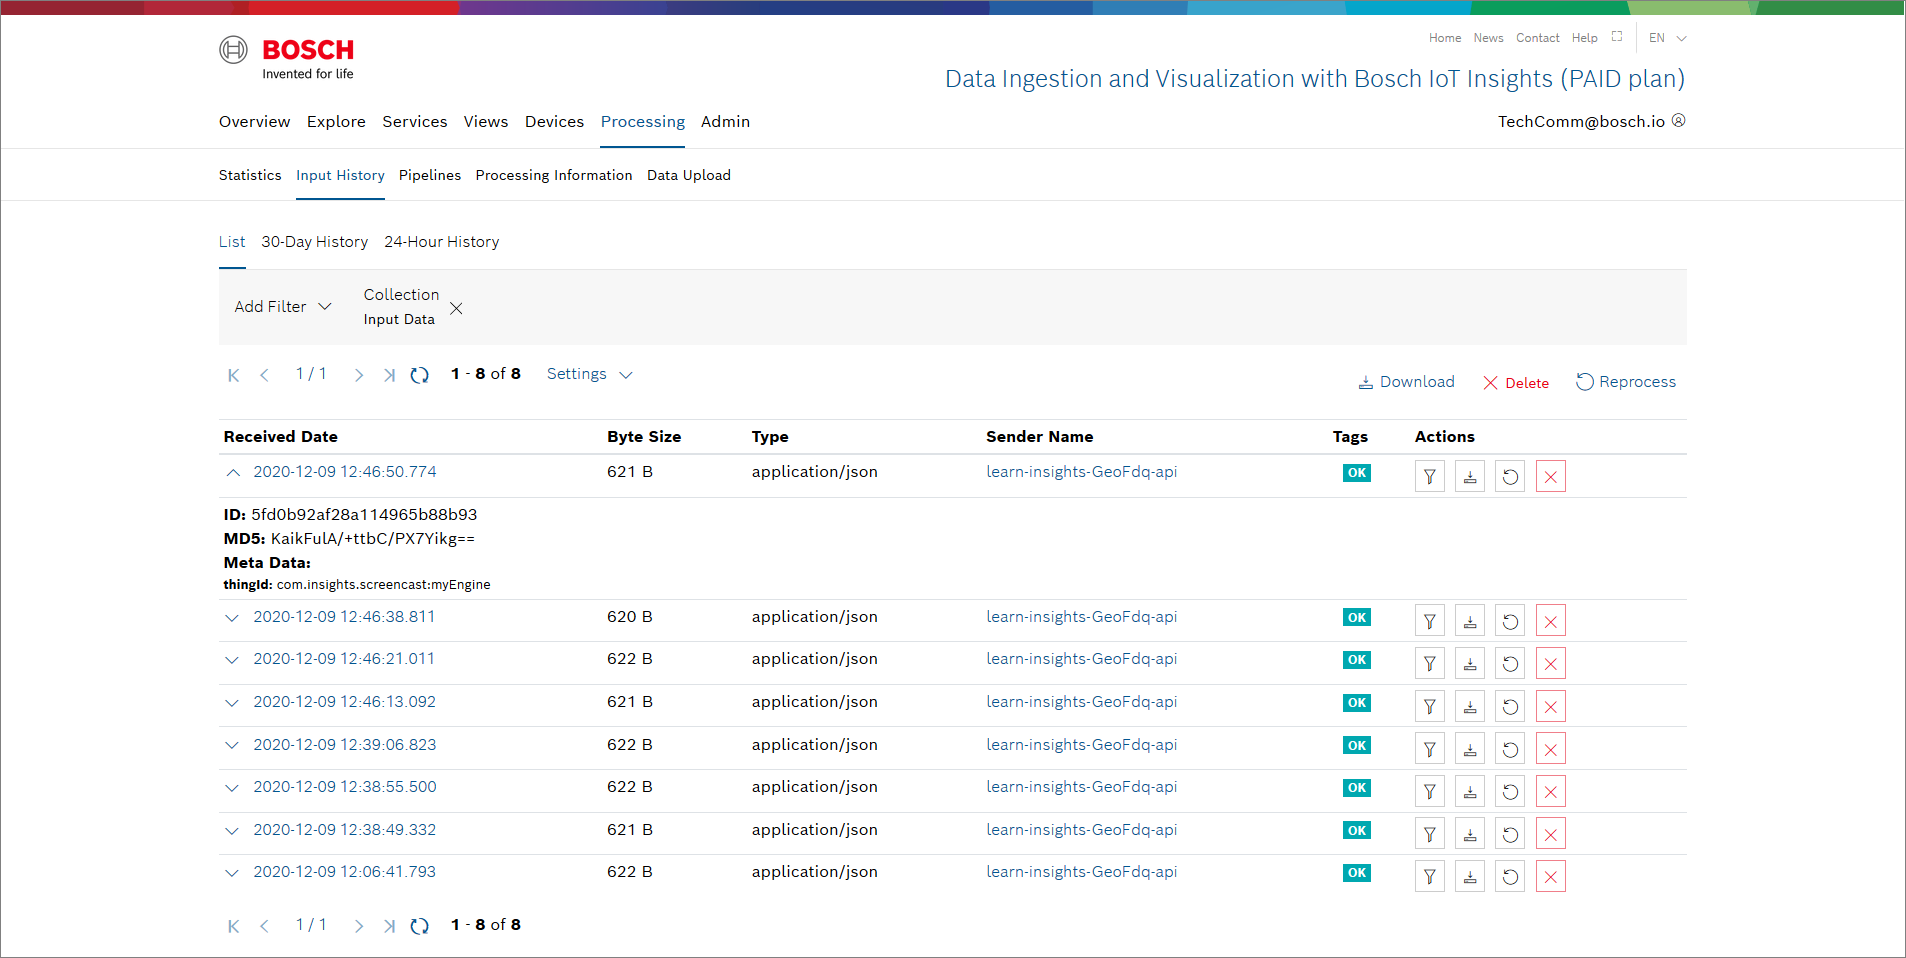
Open the Processing > Input History tab to check whether the data has been received.
Check the entries for the latest input.
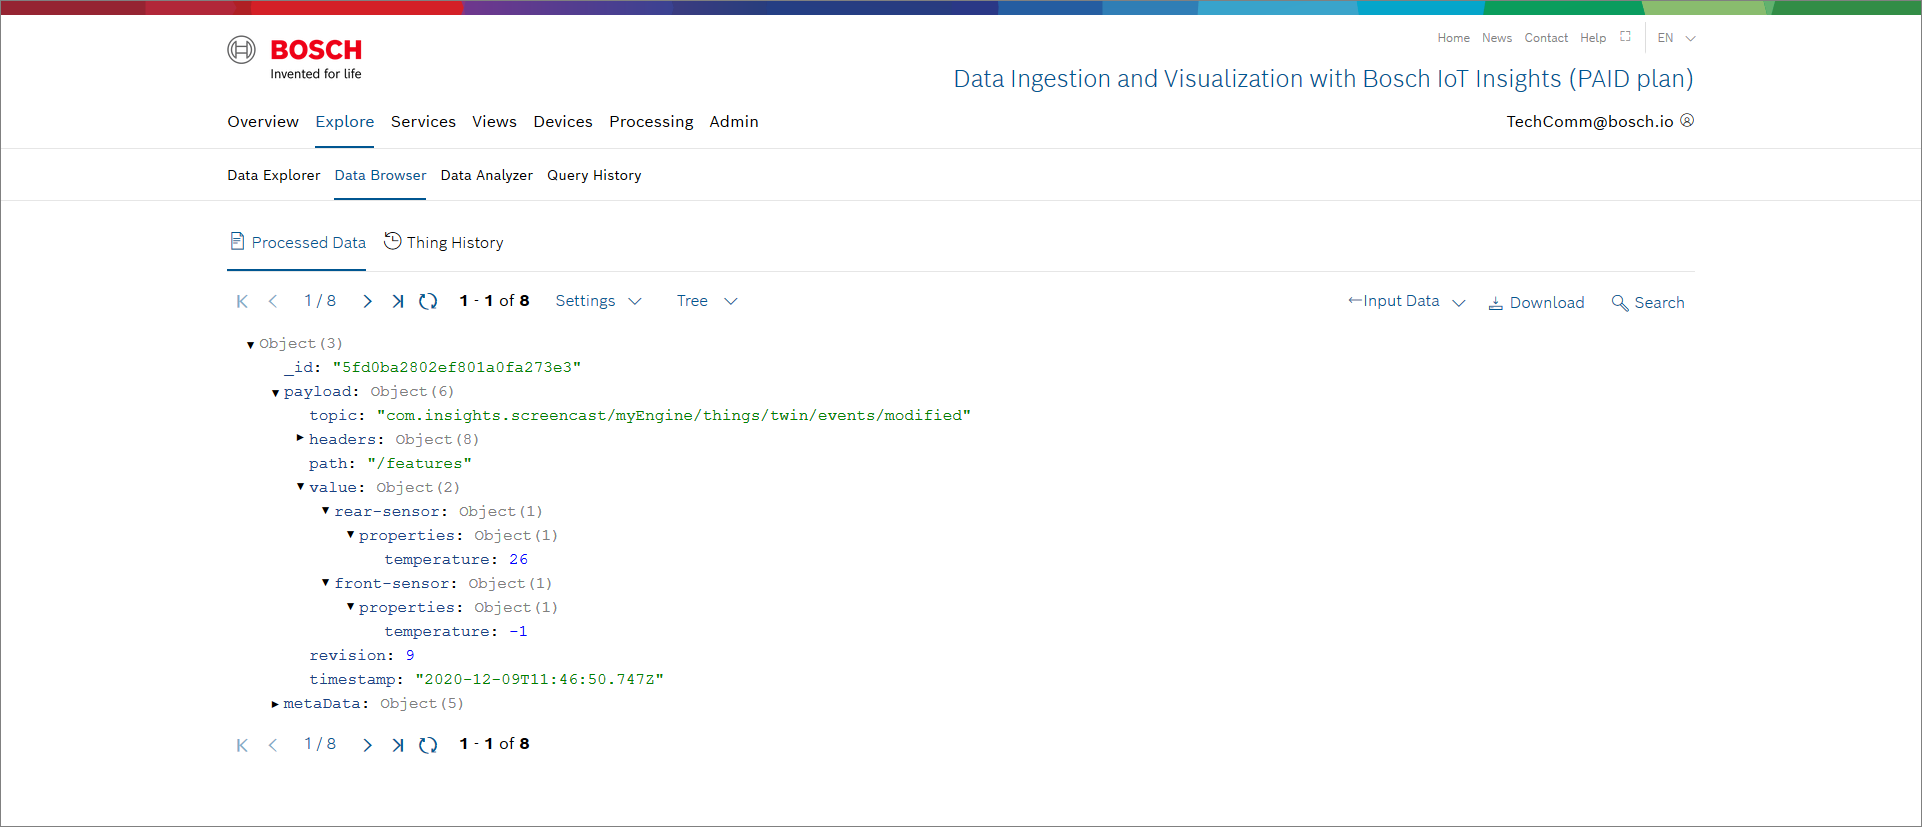
Open the Explore > Data Browser tab to check whether the data has been processed.
Click through the payload and you will find the temperature values that were sent for the front sensor and rear sensor.
If the device data has not been processed, a pipeline might not be running. Open the Processing > Pipelines tab and, if necessary, start a pipeline, refer to the Starting and stopping a pipeline chapter.
Creating a query template
To create a widget visualizing the received temperature values, a query template has to be created that serves as the data source in the widget configuration.
Proceed as follows
Open the Explore > Data Explorer tab.
Click the Add Template button to create a new query template.
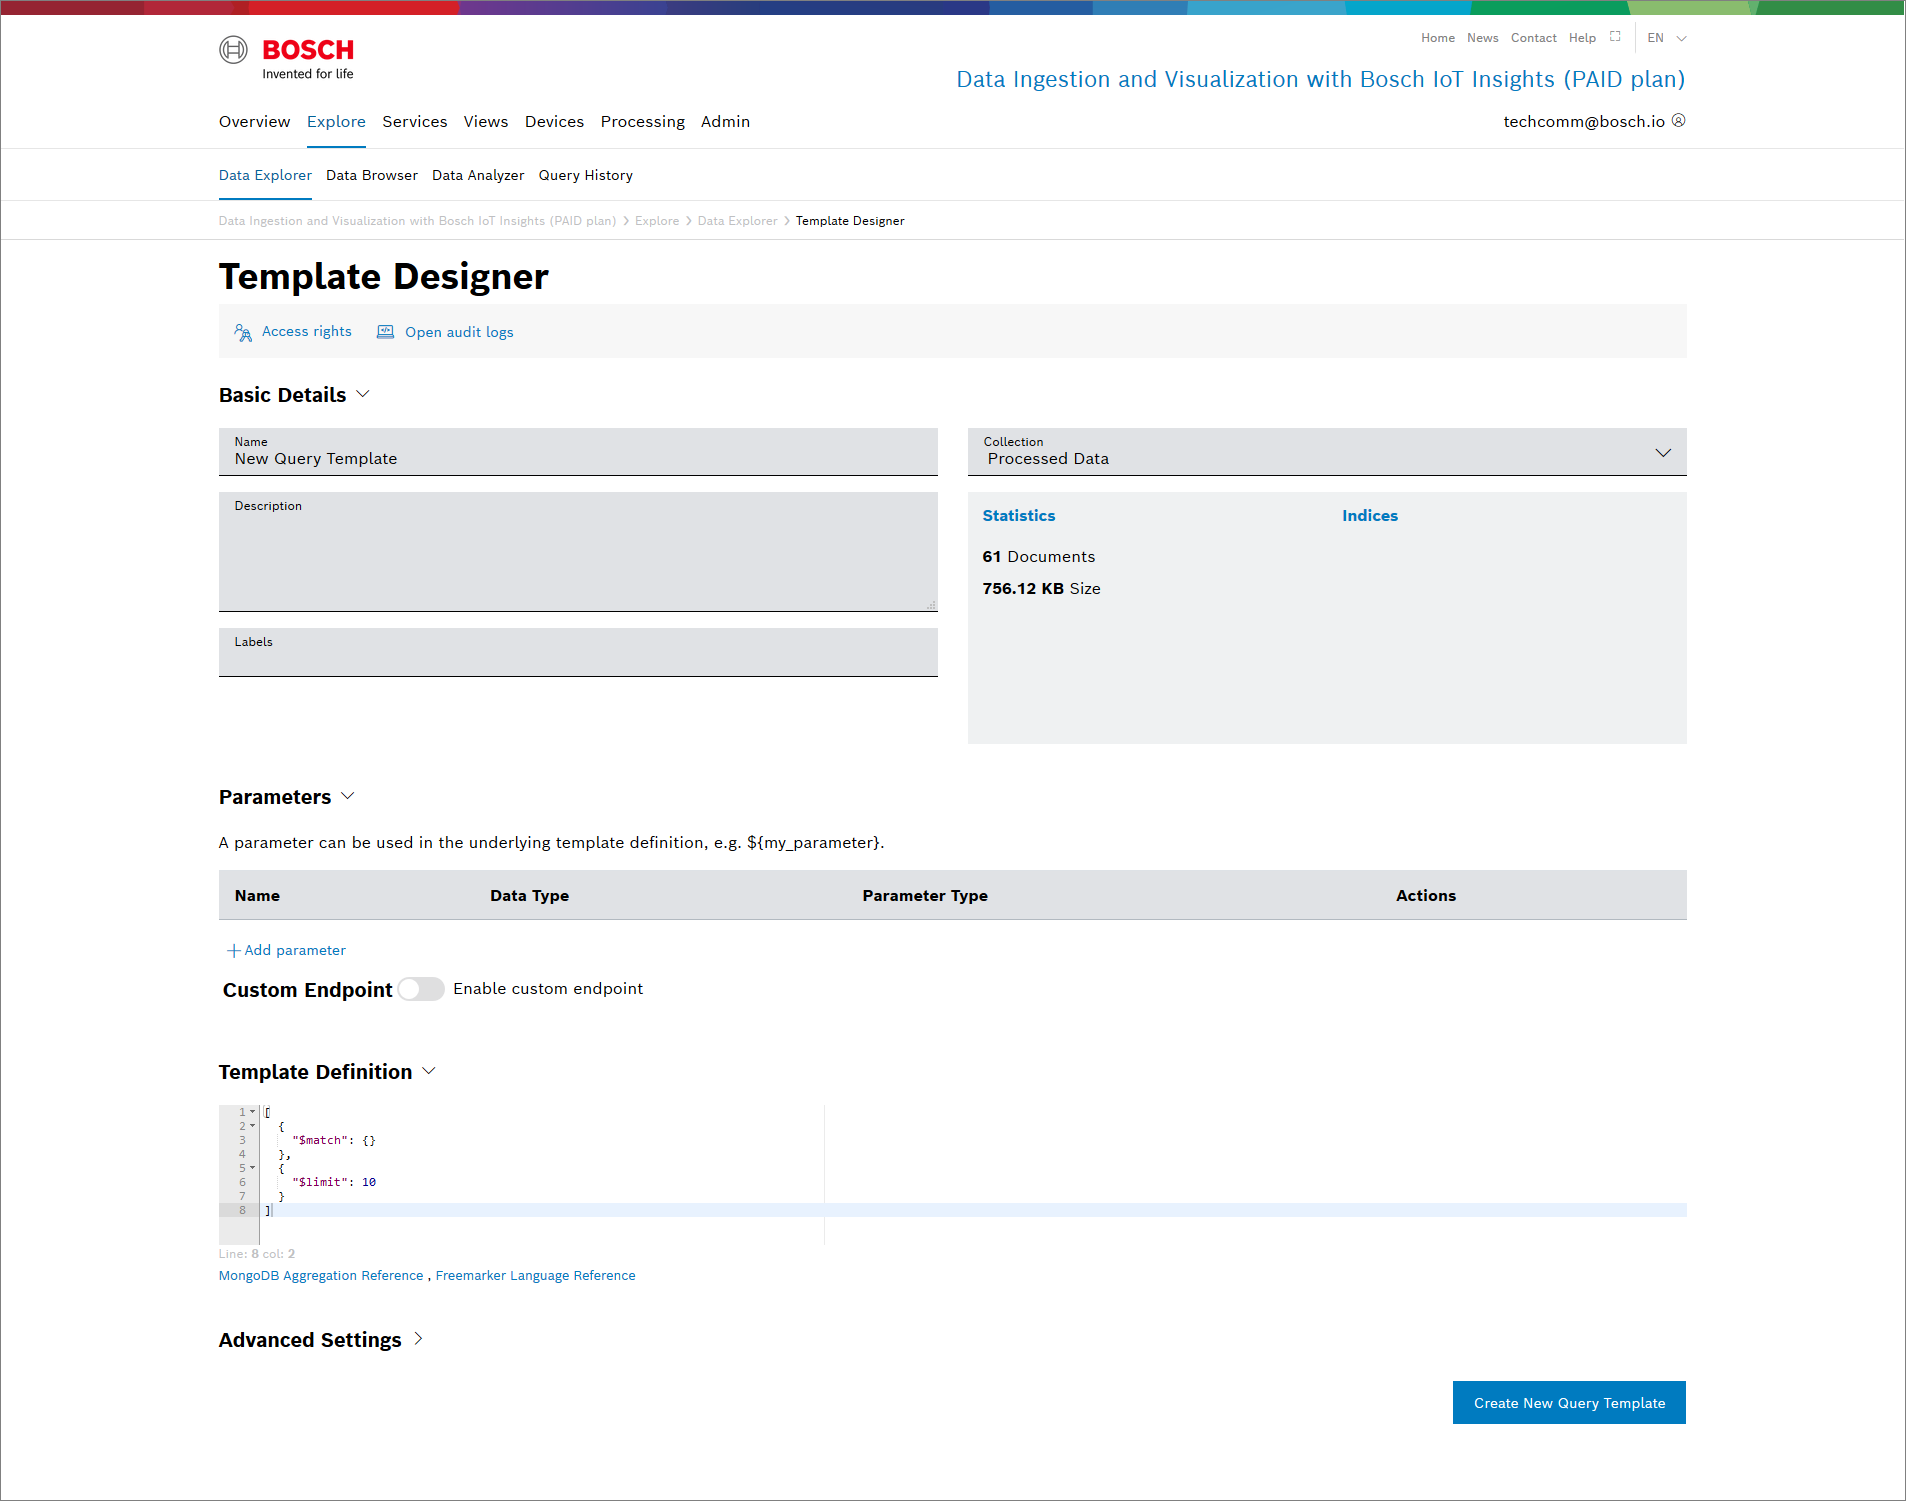
In the Name field, enter a name for the query template.
Click the Access rights button to define the access rights for the desired user roles. Refer to the Managing query template access rights chapter.
In the Template Definition pane, enter the following query.
[{"$match": {"metaData.thingId":"${engine_id}"}},{"$sort": {"_id": -1}},{"$limit":1}]In the Parameters pane, click the Add parameter button.
→ The Edit parameter dialog is displayed.In the Technical Name field, enter engine_id.
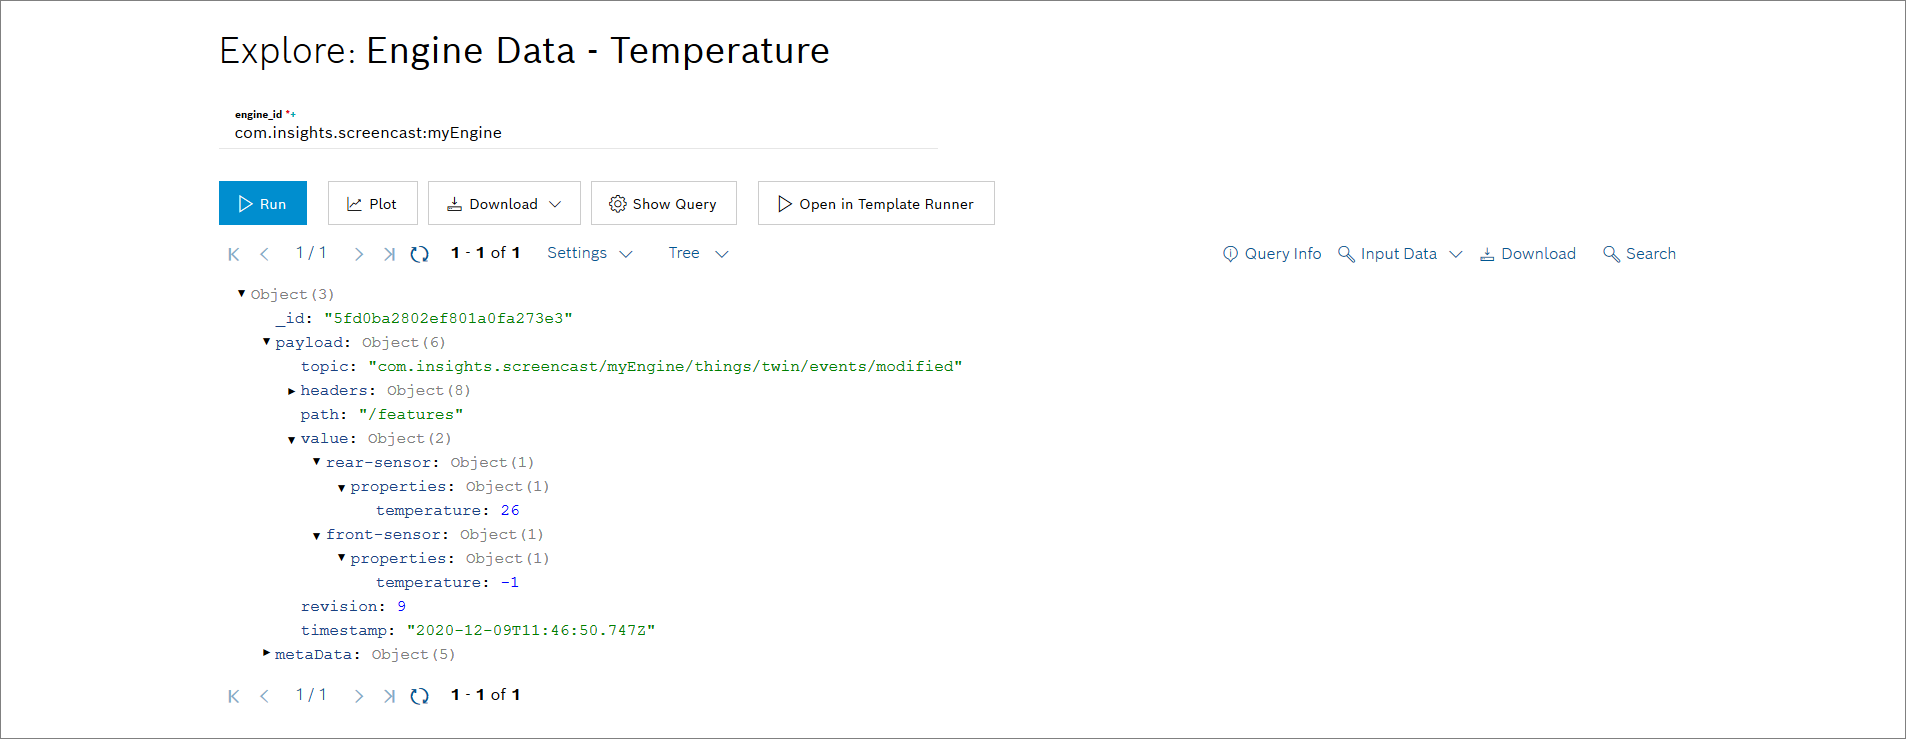
In the engine_id field below the Define default value checkbox, enter the Thing ID which consist of the namespace and the Thing's name.
Click the Save button.
Click the Save template button.
→ The template has been created.Click the Run button to check whether the template is working correctly.
Creating the Value widget with the received device data
The next step is to configure the Value widget to visualize the received temperature values.
Proceed as follows
Open the Views tab.
Open the desired dashboard you want to add the widget to.
Click the Add Widget button.
Select the Value widget.
→ The widget configuration page is displayed.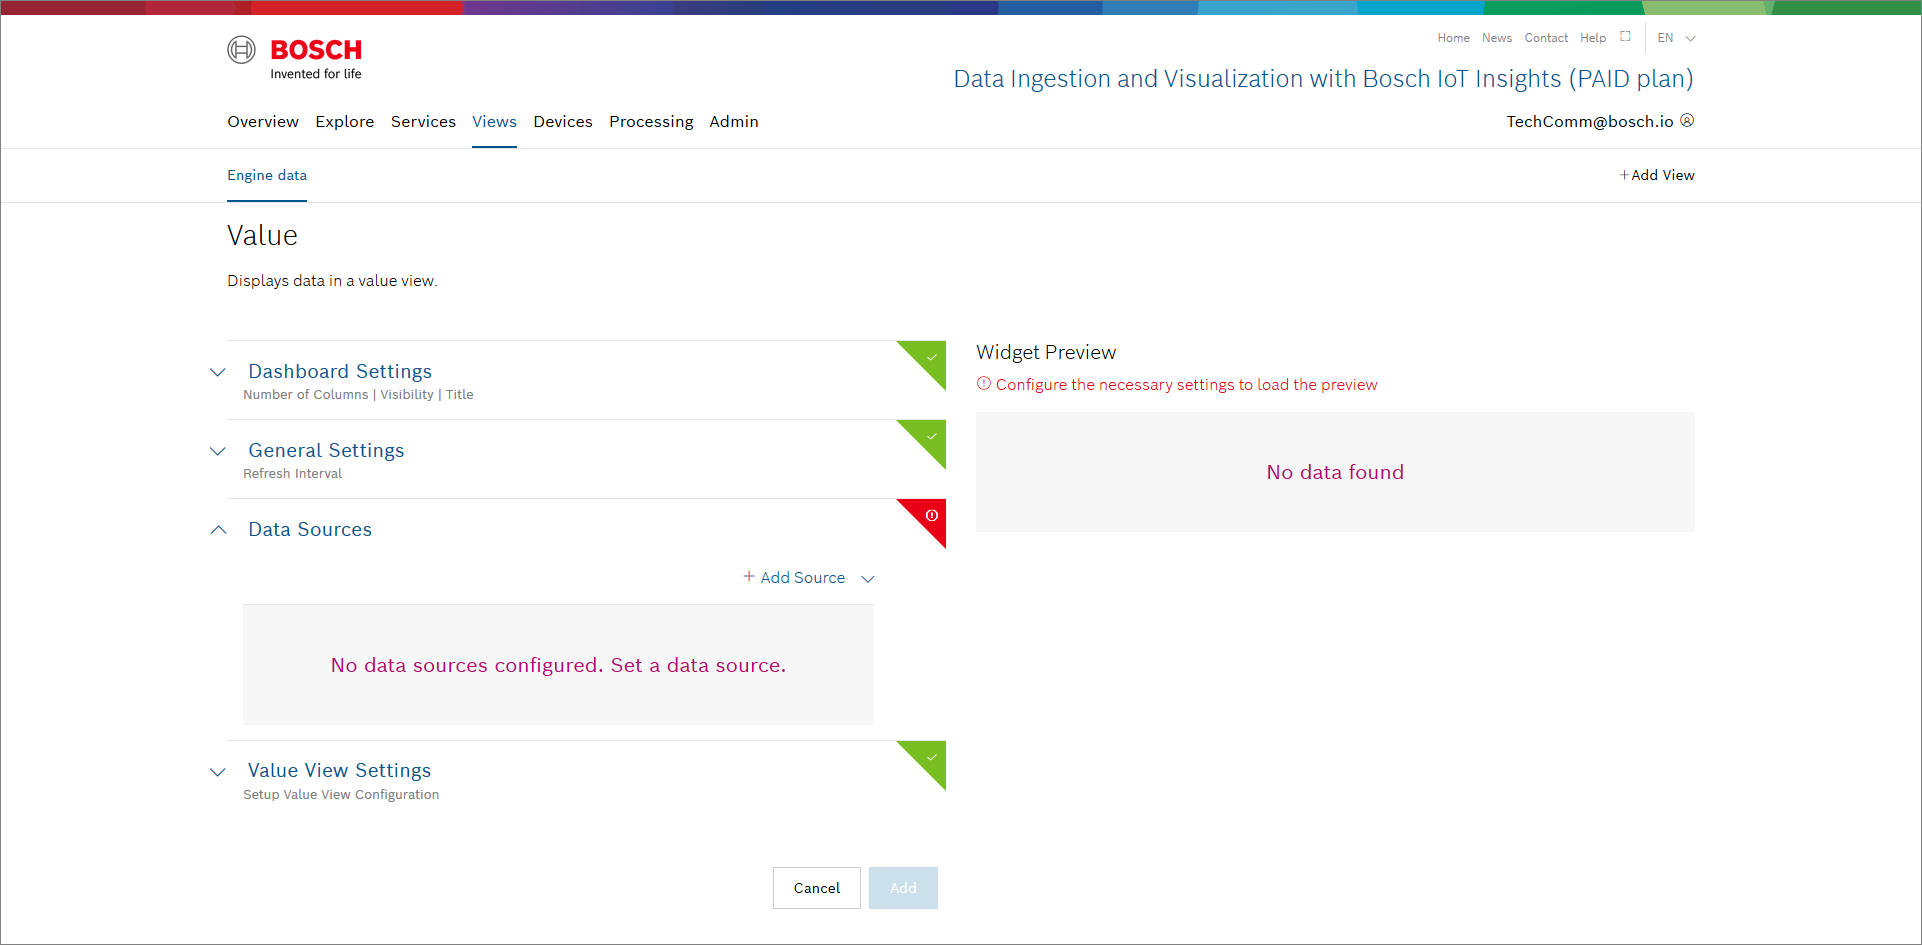
Open the Dashboard Settings pane to set how the widget is displayed in the dashboard.
In the Size drop-down list, decide how much space the widget should take in the form of columns.
In the Title field, enter a title for the widget.
Open the General Settings pane to configure some general aspects for the widget.
In the Widget Refresh Interval in Seconds field, enter a value in seconds after which the widget should be refreshed.
Open the Data Sources pane to configure the data source for the widget.
Click the + Add Source button to add a data source.
Select Query Template.
In the Query Template drop-down list, select the query template you just created.
Click the Save Data Source button.
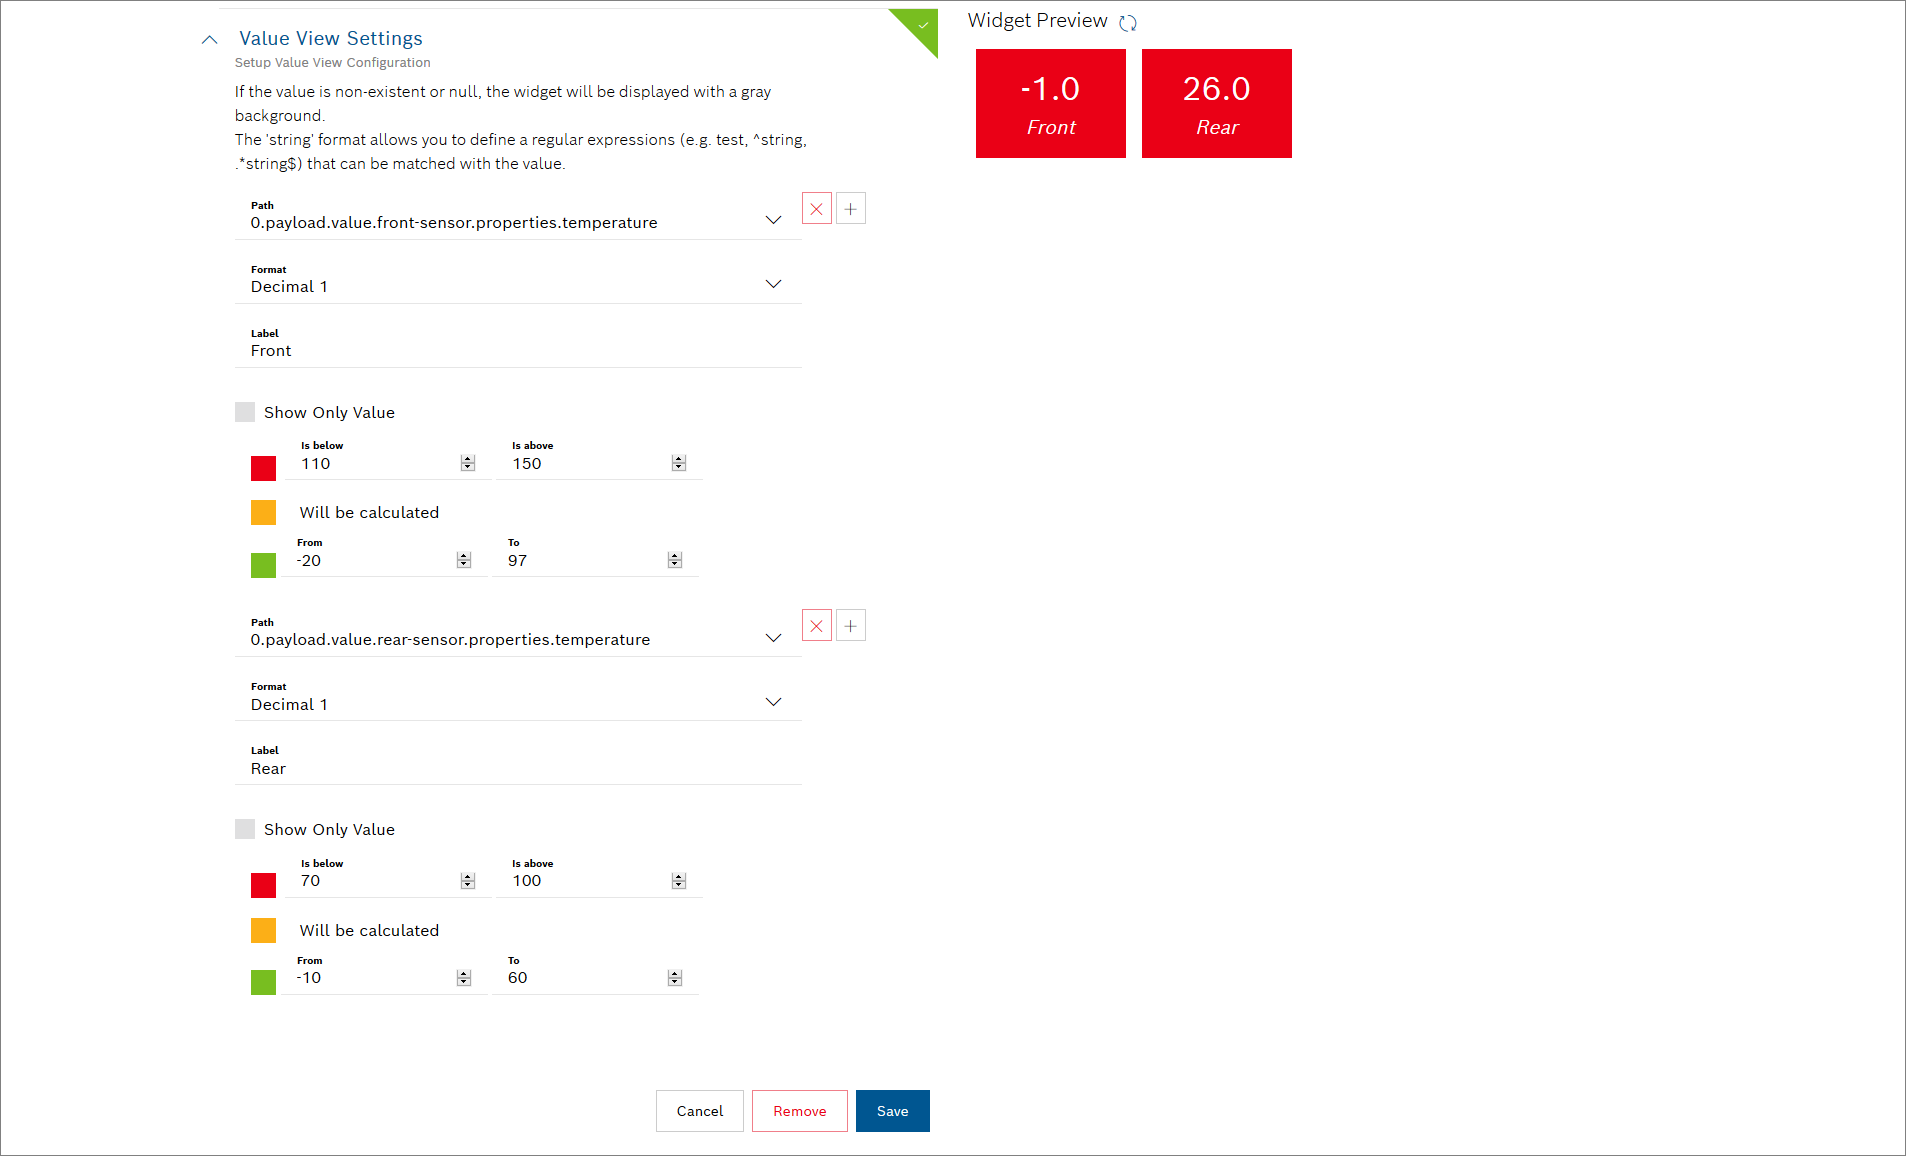
Open the Value View Settings pane to configure the value.
Click the Add Value button to open the value configuration.
In the Path drop-down list, select the 0.payload.value.front-sensor.properties.temperature parameter path.
The number in the beginning of the parameter path refers to the document number in the data source. The 0 in the example above means that the first document of the data source is considered.
In the Label field, change the name of the value.
Click the Add icon
 to add the value for the rear sensor.
In the Path drop-down list, select the 0.payload.value.rear-sensor.properties.temperature parameter path.
The number in the beginning of the parameter path refers to the document number in the data source. The 0 in the example above means that the first document of the data source is considered.
In the Label field, change the name of the value.
Optionally, deactivate the Show Only Value checkbox to set ranges for the value to be displayed in a traffic light system as described in the Optional: Adding color indicators section.
Click the Add button.
→ The Value widget is added to the dashboard and shows the values that were sent the first time.
Optional: Adding color indicators
A traffic light system can be added to the temperature values.
Proceed as follows
Deactivate the Show Only Value checkbox to set ranges for the value to be displayed in a traffic light system.
Add the desired values to the Is below and Is above fields for which the red color will be displayed.
Add the desired values to the From and To fields for which the green color will be displayed.
Sending device data again
As a last step, watch how the temperature values in the widget change when you send them again using the API development tool.
Proceed as follows
Click the Send button in the Modify the temperatures PUT request.
Open the dashboard in which the Value widget is located.
→ The temperature values are automatically updated. You can also click the Refresh icon .
.