Direct data ingestion and visualization
There are many ways to ingest device data in Bosch IoT Insights. One way is to use the HTTP Data Recorder to directly ingest data. This tutorial explains - as a first step - the setup of the API development platform. Subsequently, we will send device data to Bosch IoT Insights. The next steps show the creation of a query template which serves as the data source for the Illustration widget which we will add to the dashboard afterwards.
The example device will be an engine with a front and rear temperature sensor. We will simulate how the temperature of the two sensors changes.
The ZIP folder consists of the following files:
the Postman collection
the template definition for the query template
an image for the Illustration widget
The content of the Data Ingestion and Visualization tutorial is also available as a video here.

This chapter details the following topics:
Adjusting the provided collection in the API development tool
Creating the Illustration widget with the received device data
Adjusting the provided collection in the API development tool
To send device data to your Bosch IoT Insights project, we have provided a collection that consists of a POST requests for sending the device data. First values have to be added to the set variables.
For our tutorial, we used Postman as an API development tool. Of course, you can use any other tool to execute the following steps.
Download the provided ZIP folder which contains the collection.
Open Postman.
Click the Import button and select the downloaded collection.
Click the View more actions icon of the collection and select Edit.
→ The EDIT COLLECTION dialog is displayed.Open the Variables tab.
→ All variables provided in the collection are listed.In the CURRENT VALUE field of the insights_project_id variable, enter the Project ID.
You can find the Project ID in the binding credentials of your subscription. The Project ID is also located in the URL of your project.
Open the Authorization tab.
In the TYPE drop-down list, select Basic Auth.
Create an API user in your Bosch IoT Insights project as described in the Creating an API user in Bosch IoT Insights section.
For the username variable, open the Variables tab in Postman.
In the CURRENT VALUE field of the username variable, enter the username of the API user that you created in the Creating an API user in Bosch IoT Insights section.
For the password, open the Authorization tab.
In the Password field, enter the password of the API user that you created in the Creating an API user in Bosch IoT Insights section.
Click the Update button.
→ All changes made in the Authorization tab and the Variables tab have been saved.
Creating an API user in Bosch IoT Insights
To send device data via the HTTP Data Recorder, the credentials of an API user are required. In Bosch IoT Insights, an API user serves as a data provider.
Proceed as follows
Open your Bosch IoT Insights project.
Open the Admin > Users tab.
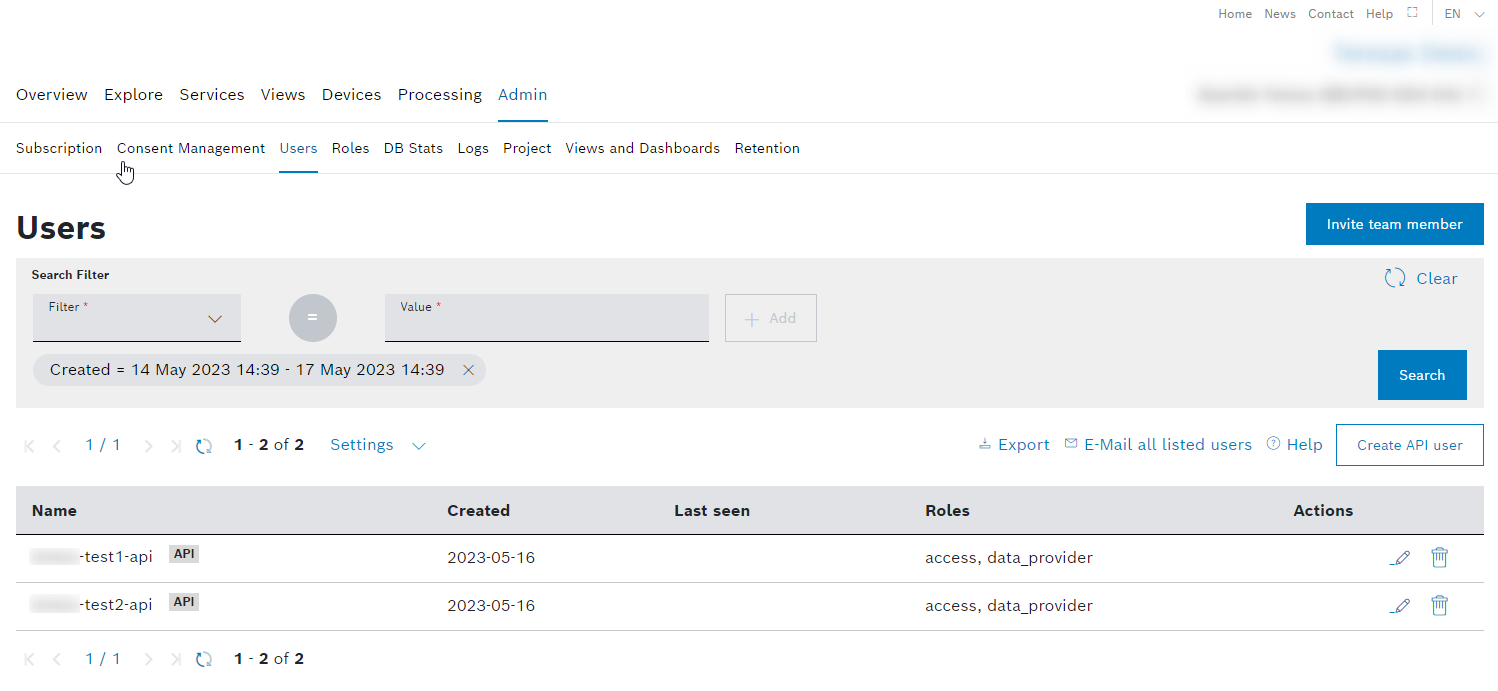
Click the Create API User button to add an API user.
→ The credentials are displayed in the Create API User dialog.The dialog provides the credentials for the API user to log in on API level. It is highly recommended to take a note of the credentials as they cannot be read out again.
Sending device data to Bosch IoT Insights
Now that everything has been set up in the API development tool, the device data can be sent to your Bosch IoT Insights project. The request body shows the front sensor and the rear sensor of the engine as well as the values that shall be sent. In the Pre-Request Script, values have been provided which will be sent randomly to your project.
Proceed as follows
Open the Data Recorder Service (single engine) POST request.
Click the Send button.
→ A 200 OK has been returned and values sent to the Bosch IoT Insights project. The response also contains the Input Data ID, the collection the data was sent to and the file size.
Checking whether device data has been processed
The next step is to check whether your Bosch IoT Insights project has processed the sent temperature values.
Proceed as follows
Open your Bosch IoT Insights project.
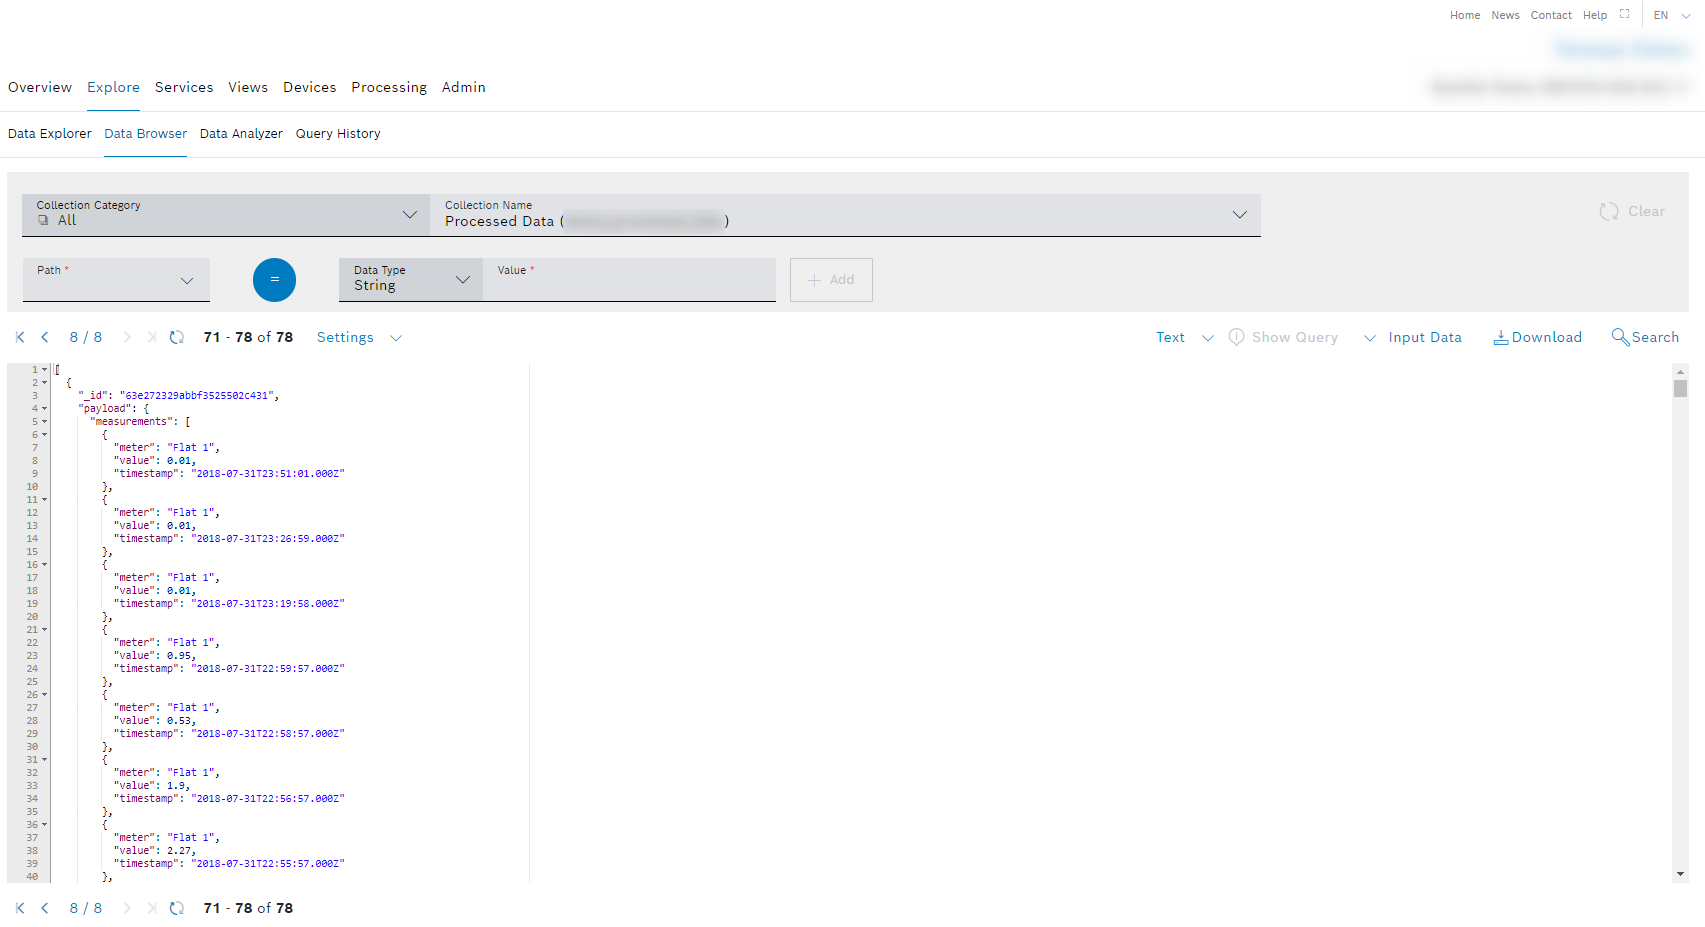
Open the Explore > Data Browser tab to check whether the data has been processed.
Click through the payload and you will find the temperature values that were sent for the front sensor and rear sensor.
If the device data has not been processed, a pipeline might not be running. Open the Processing > Pipelines tab and, if necessary, start a pipeline, refer to the Starting and stopping a pipeline chapter.
Creating a query template
To create a widget visualizing the received temperature values, a query template has to be created that serves as the data source in the widget configuration.
Proceed as follows
Open the Explore > Data Explorer tab.
Click the Add Query Template button to create a new query template.
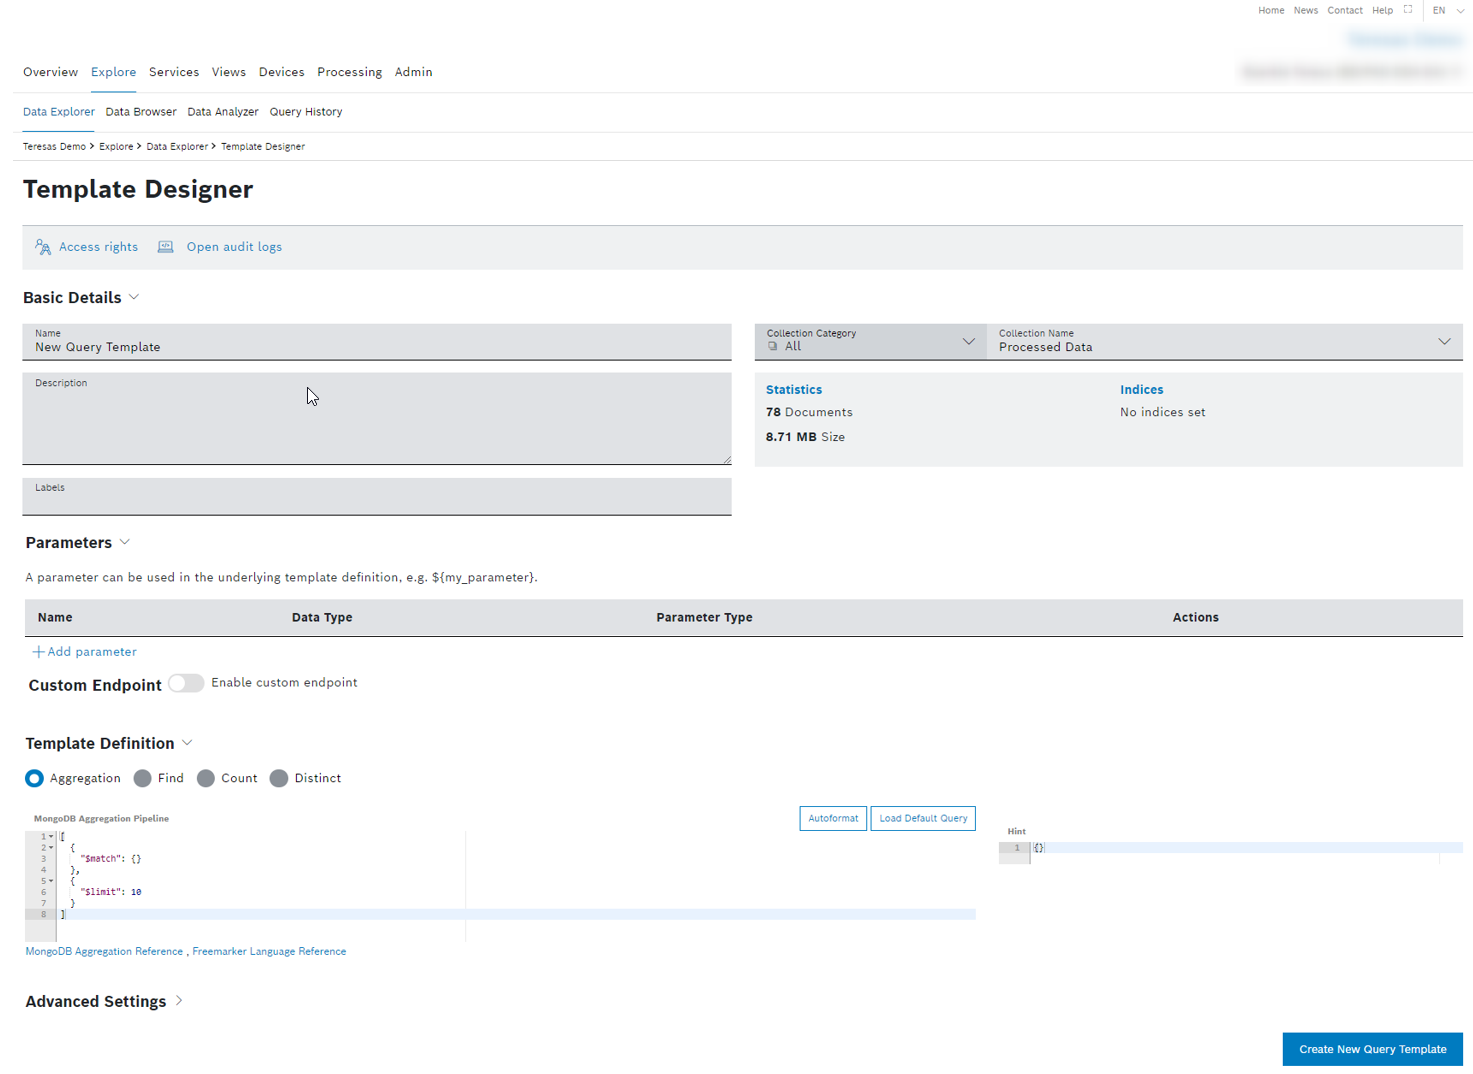
In the Name field, enter a name for the query template.
Click the Access rights button to define the access rights for the desired user roles. Refer to the Managing query template access rights chapter.
In the Template Definition pane, enter the following query.
[{"$match": {"payload.id": ${engine_id}}},{"$sort": {"_id": -1}},{"$limit":1}]In the Parameters pane, click the Add parameter button.
→ The Edit Parameter dialog is displayed.In the Technical Name field, enter engine_id.
In the engine_id field below the Define Default Value checkbox, enter the ID of the engine.
Click the Save button.
Click the Create New Query Template button.
→ The template has been created.Click the Run button to check whether the template is working correctly.
Creating the Illustration widget with the received device data
The next step is to configure the Illustration widget to visualize the received temperature values.
Proceed as follows
Open the Views tab.
Open the desired dashboard you want to add the widget to.
Click the Add Widget button.
Select the Illustration widget.
→ The widget configuration page is displayed.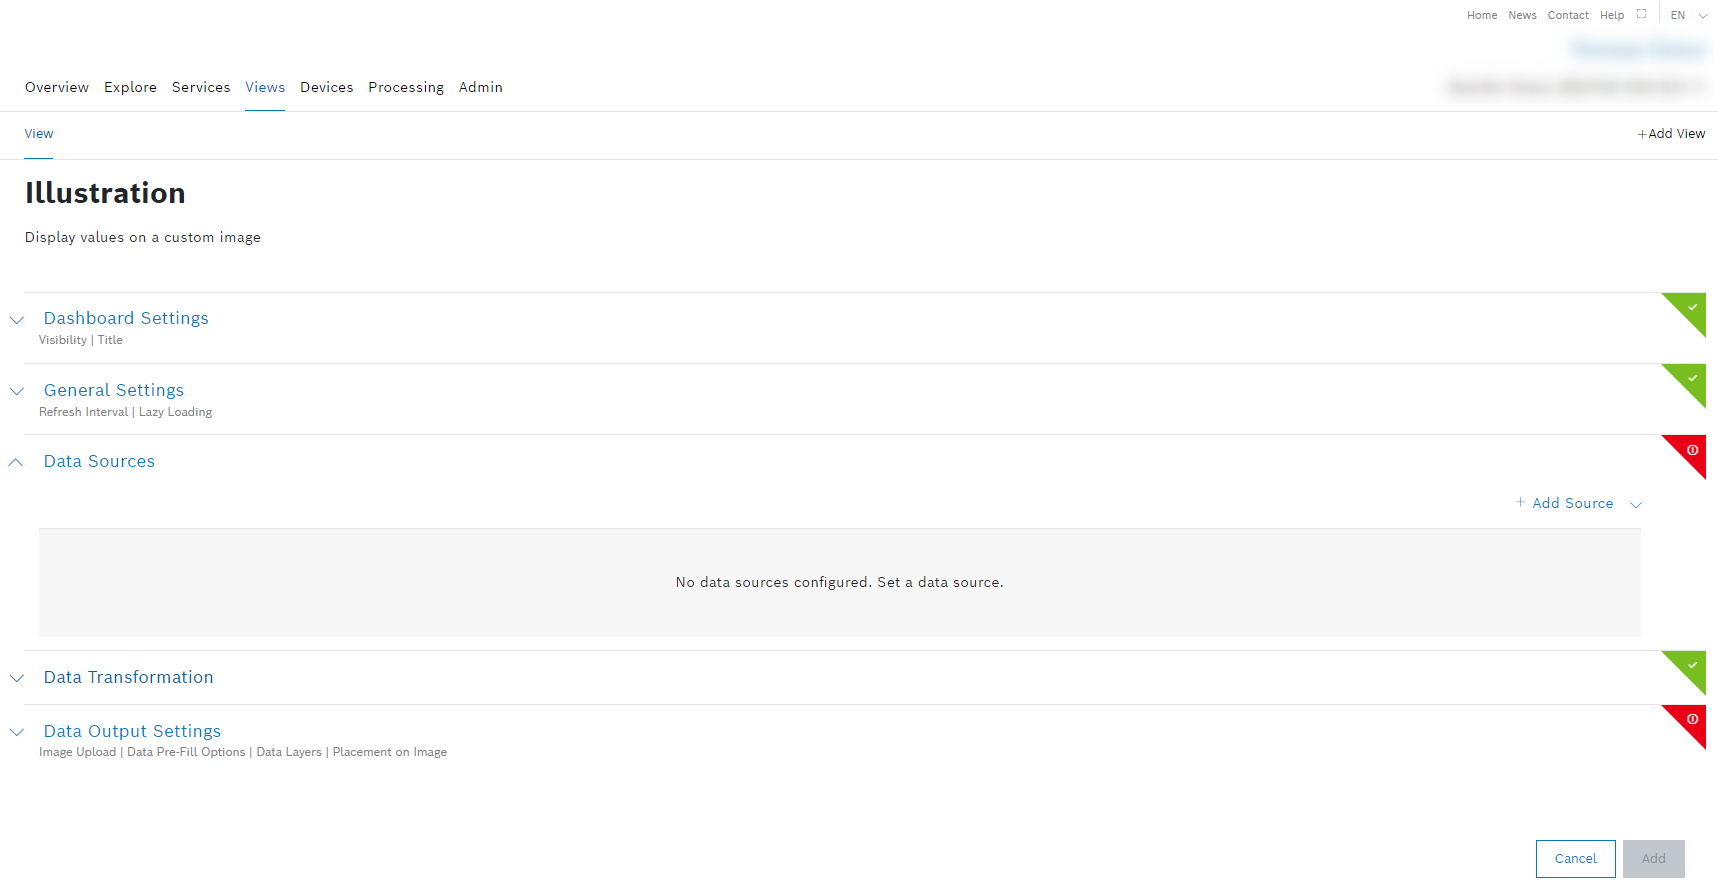
Open the Dashboard Settings pane to set how the widget is displayed in the dashboard.
In the Size drop-down list, decide how much space the widget should take in the form of columns.
In the Title field, enter a title for the widget.
Open the General Settings pane to configure some general aspects for the widget.
In the Widget Refresh Interval in Seconds field, enter a value in seconds after which the widget should be refreshed.
Open the Data Sources pane to configure the data source for the widget.
Click the + Add Source button to add a data source.
Select Query Template.
In the Query Template drop-down list, select the query template you just created.
Click the Save Data Source button.
Open the Data Output Settings pane to upload an image and add values.
Click the Upload Image field to select the image provided in the ZIP folder.
→ The selected image is displayed.
Click the Upload Image button to upload the image.
→ The image is uploaded and displayed in the image container.Click the Add Data Layer button to add the temperature value of the front temperature sensor to the image.
→ The Layer Configuration dialog is displayed.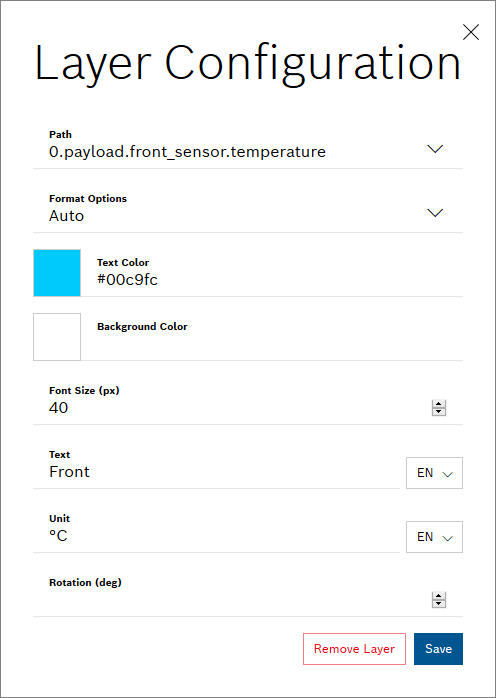
In the Path field, select the 0.payload.value.front-sensor.properties.temperature parameter path.
The number in the beginning of the parameter path refers to the document number in the data source. The 0 in the example above means that the first document of the data source is considered.
Click the color square to select any Text Color or enter a color code.
In the Font Size (px) field, enter the font size for the value.
In the Text field, enter the name of the value.
In the Unit field, enter the unit for the value.
Click the Save button.
Drag the value closer to the corresponding sensor.
Repeat the steps e–k to add the data layer for the rear temperature sensor with the 0.payload.value.rear-sensor.properties.temperature parameter to the image.
Click the Add button.
→ The Illustration widget is added to the dashboard and shows the values that were sent the first time.
Sending device data again
As a last step, watch how the temperature values in the widget change when you send them again using the API development tool.
Proceed as follows
Click the Send button in the Data Recorder Service (single engine) POST request.
Open the dashboard in which the Illustration widget is located.
→ The temperature values are automatically updated. You can also click the Refresh icon .
.