Displaying device data with the Filter widget
If you have a lot of widgets of the same kind on your dashboard, you may benefit from using the Filter widget (formerly called Filter Panel widget) which can be connected with other widgets. The device information you need will still be displayed.
In this tutorial, we will display the temperature values of the front and rear sensors of three different engines. Therefore, we will create a Value widget as well as a Filter widget.
For this tutorial, we created three engines in the Devices menu which is not part of this tutorial. For further information on this topic, refer to the following chapters in the documentation:
The content of the Displaying Device Data with the Filter Widget tutorial is also available as a video here.

This chapter details the following topics:
Creating the query template
In this tutorial, we will use a query template similar to the one in the Direct data ingestion and visualization tutorial. This query template will later serve as the data source of the Value widget.
Proceed as follows
Open the Explore > Data Explorer tab.
Click the Add Query Template button to create a new query template.
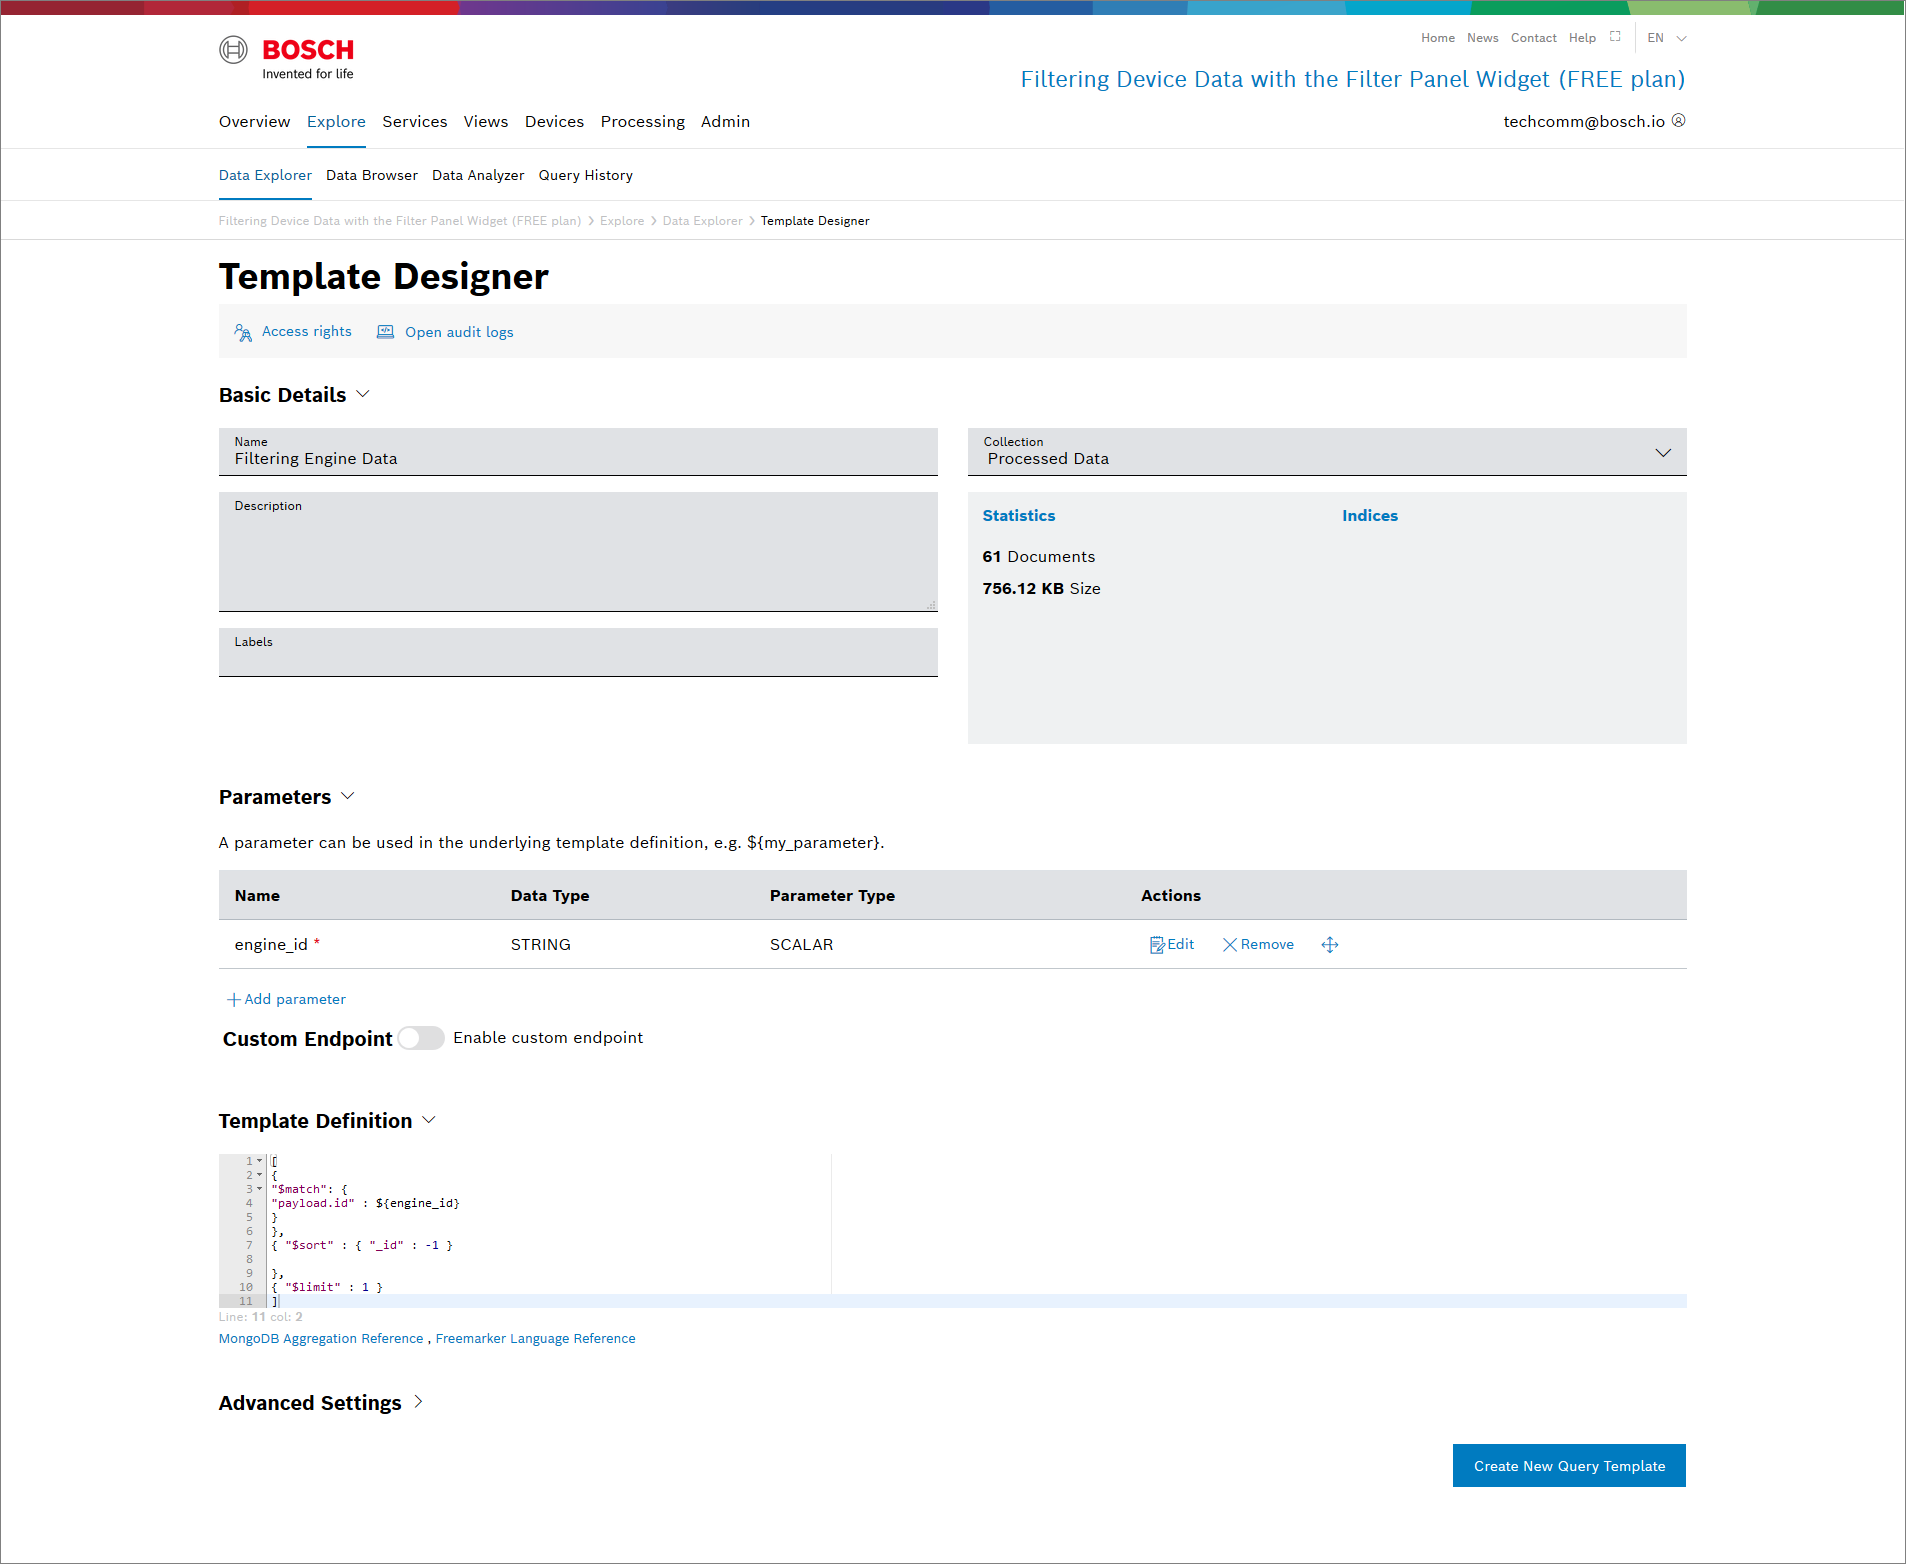
→ The Template Designer is displayed.In the Name field, enter a name for the query template.
Click the Access rights button to define the access rights for the desired user roles. Refer to the Managing query template access rights chapter.
In the Parameters pane, click the Add parameter button.
→ The Edit Parameter dialog is displayed.In the Technical Name field, enter engine_id.
Activate the Provide Choices checkbox to add the engine IDs and their labels.
Click the Add choice button to add a row for each engine.
Enter a Label and the engine IDs.
In the engine_id field below the Define Default Value checkbox, select the engine that should be set as default engine.
Click the Save button.
In the Template Definition pane, enter the following query.
[{"$match": {"payload.id": ${engine_id}}},{"$sort": {"_id": -1}},{"$limit":1}]Click the Create New Query Template button.
→ The template has been created.Test-run the query template with each engine by clicking the Run button to check whether the query template is working correctly.
The query template for this tutorial has been configured as follows:
Creating the Value widget
The next step is to configure the Value widget to visualize the received temperature values.
Proceed as follows
Open the Views tab.
Open the desired dashboard you want to add the widget to.
Click the Add Widget button.
Select the Value widget.
→ The widget configuration page is displayed.Open the Dashboard Settings pane to set how the widget is displayed in the dashboard.
In the Size drop-down list, decide how much space the widget should take in the form of columns.
In the Title field, enter a title for the widget.
Open the Data Sources pane to configure the data source for the widget.
Click the + Add Source button to add a data source.
Select Query Template.
In the Query Template drop-down list, select the query template you just created.
Click the Save Data Source button.
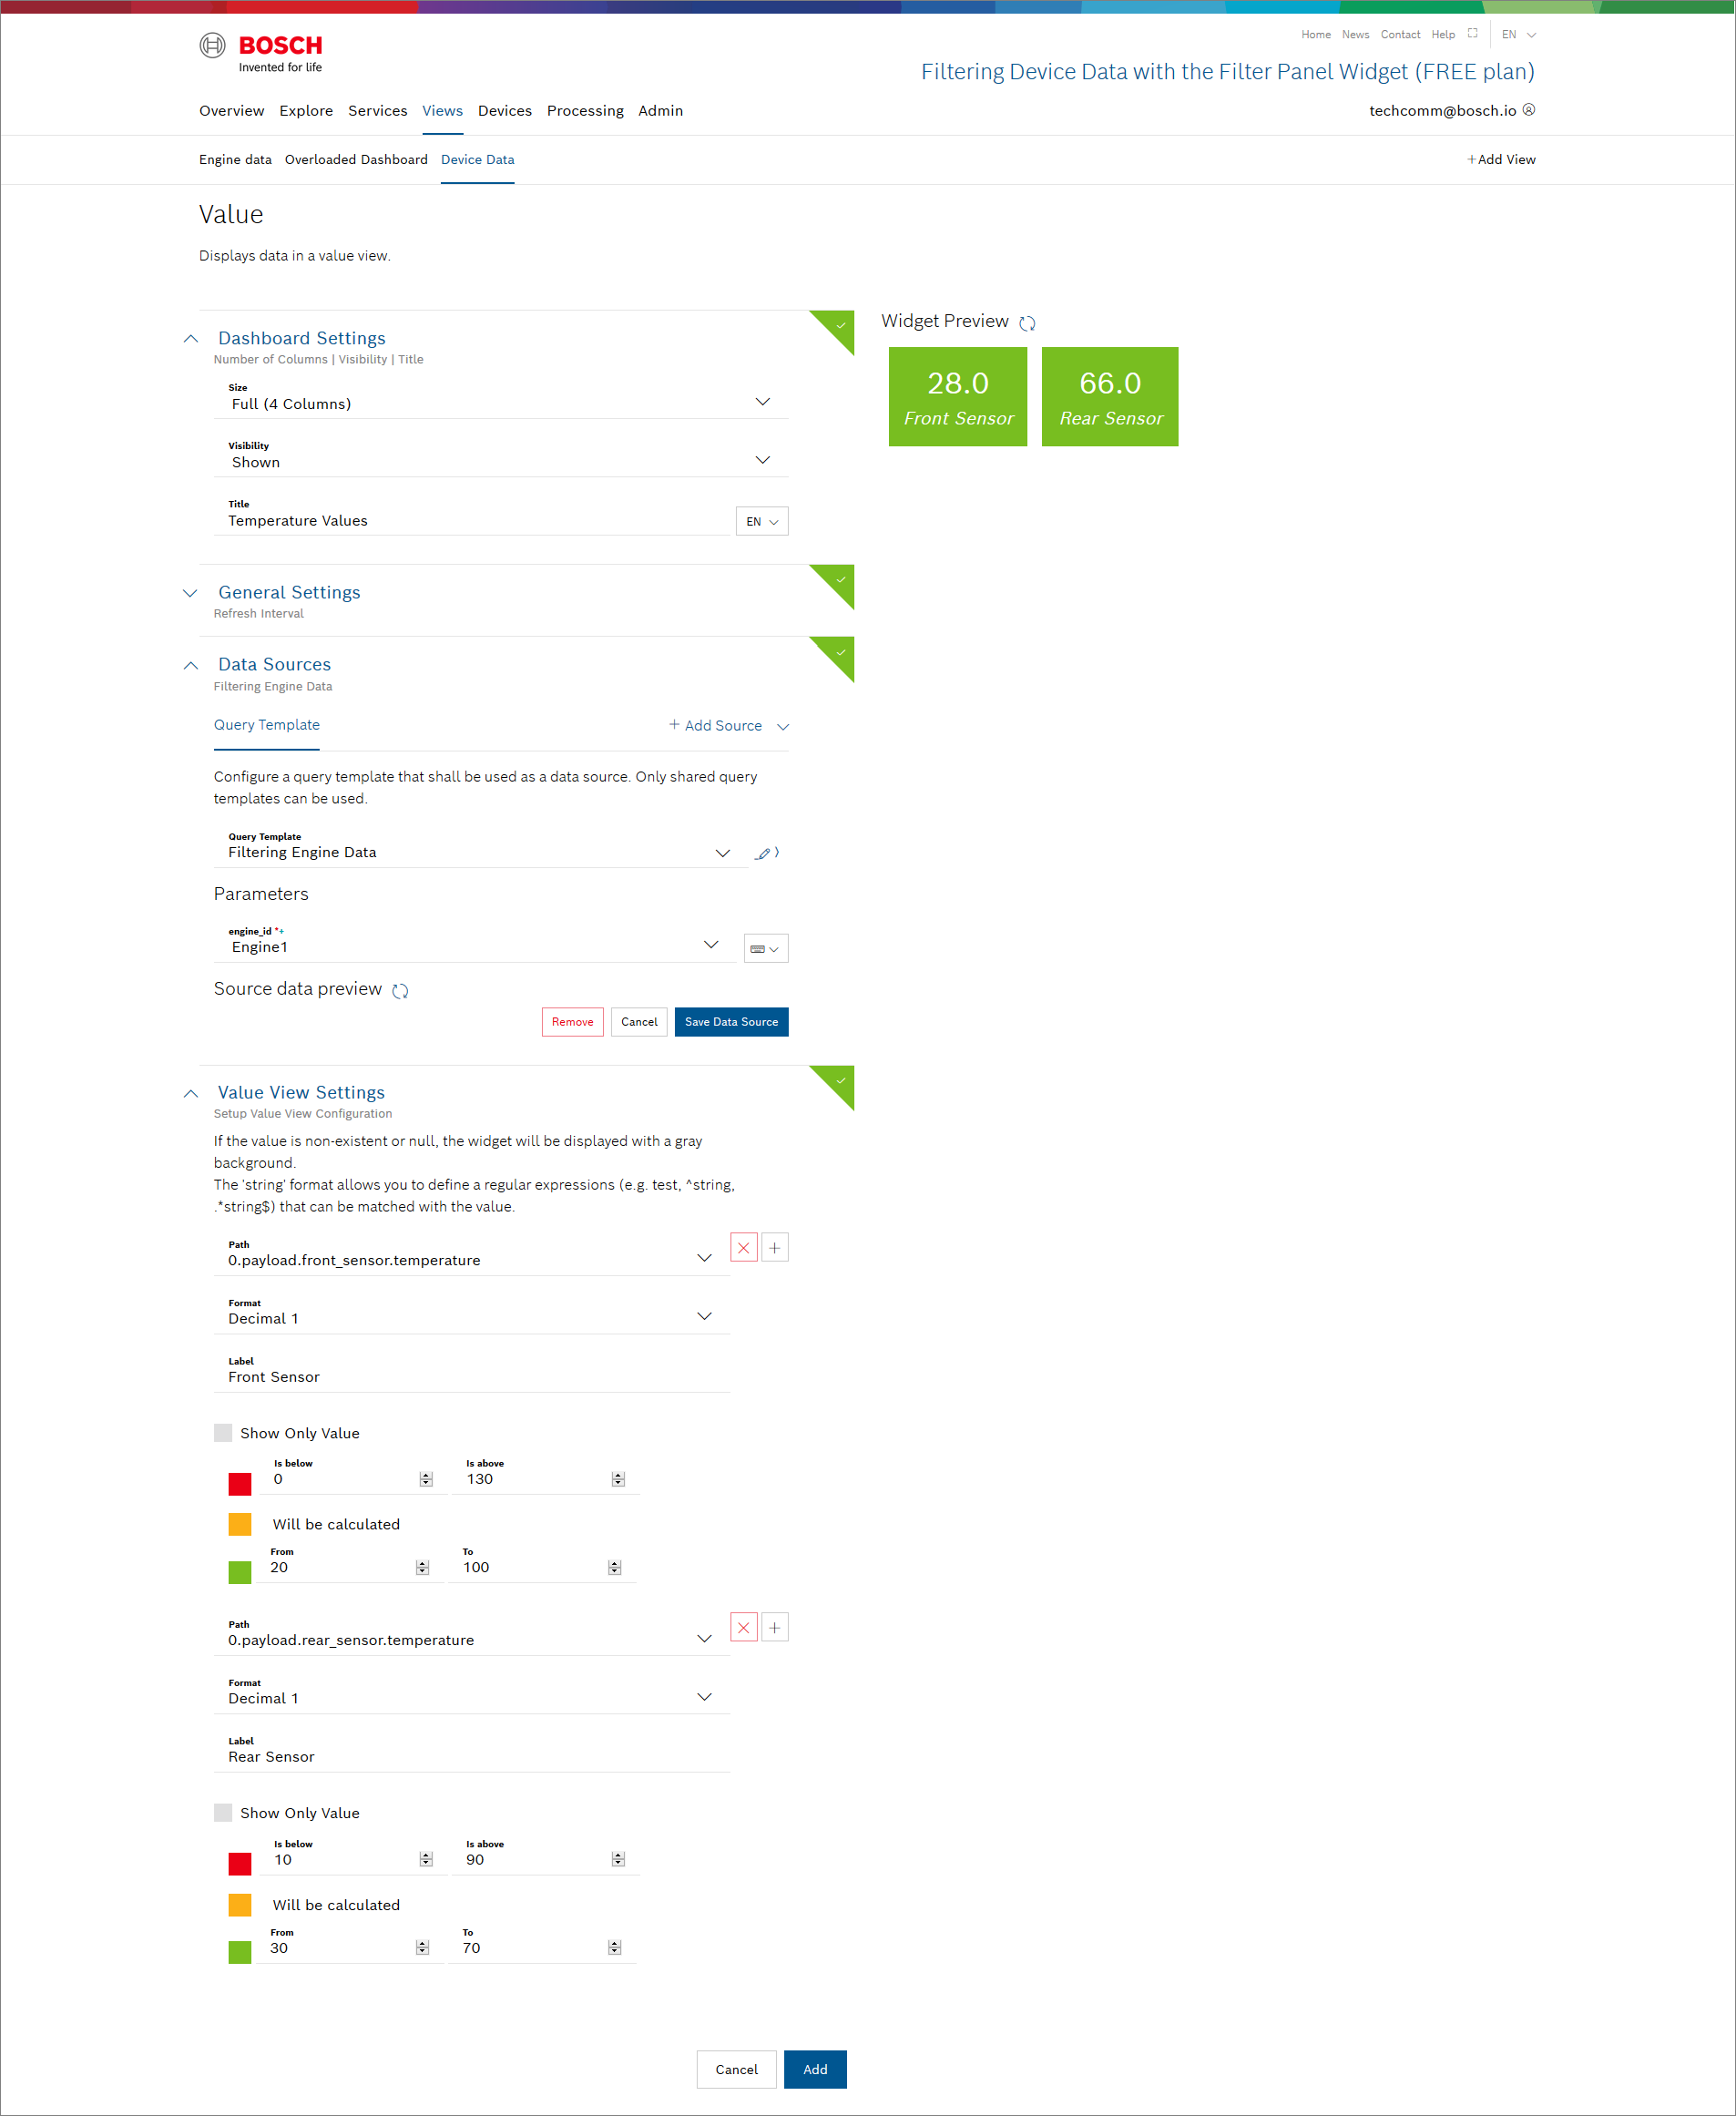
Open the Value View Settings pane to configure the value.
Click the Add Value button to open the value configuration.
In the Path drop-down list, select the 0.payload.value.front-sensor.properties.temperature parameter path.
The number in the beginning of the parameter path refers to the document number in the data source. The 0 in the example above means that the first document of the data source is considered.
In the Label field, change the name of the value.
Click the Add icon
 to add the value for the rear sensor.
In the Path drop-down list, select the 0.payload.value.rear-sensor.properties.temperature parameter path.
The number in the beginning of the parameter path refers to the document number in the data source. The 0 in the example above means that the first document of the data source is considered.
In the Label field, change the name of the value.
Optionally, deactivate the Show Only Value checkbox to set ranges for the value to be displayed in a traffic light system as described in the Optional: Adding color indicators section in the Data ingestion and visualization tutorial.
Click the Add button.
→ The Value widget is added to the dashboard and shows the values of the default engine that were sent.
The Value widget for this tutorial has been configured as follows:
Creating the Filter widget
To have the temperature values of the other values displayed in the Value widget, we need to create a Filter widget that will later be linked to the Value widget.
Note that you can only add one Filter widget per dashboard.
Proceed as follows
Click the Add Widget button.
Select the Filter widget.
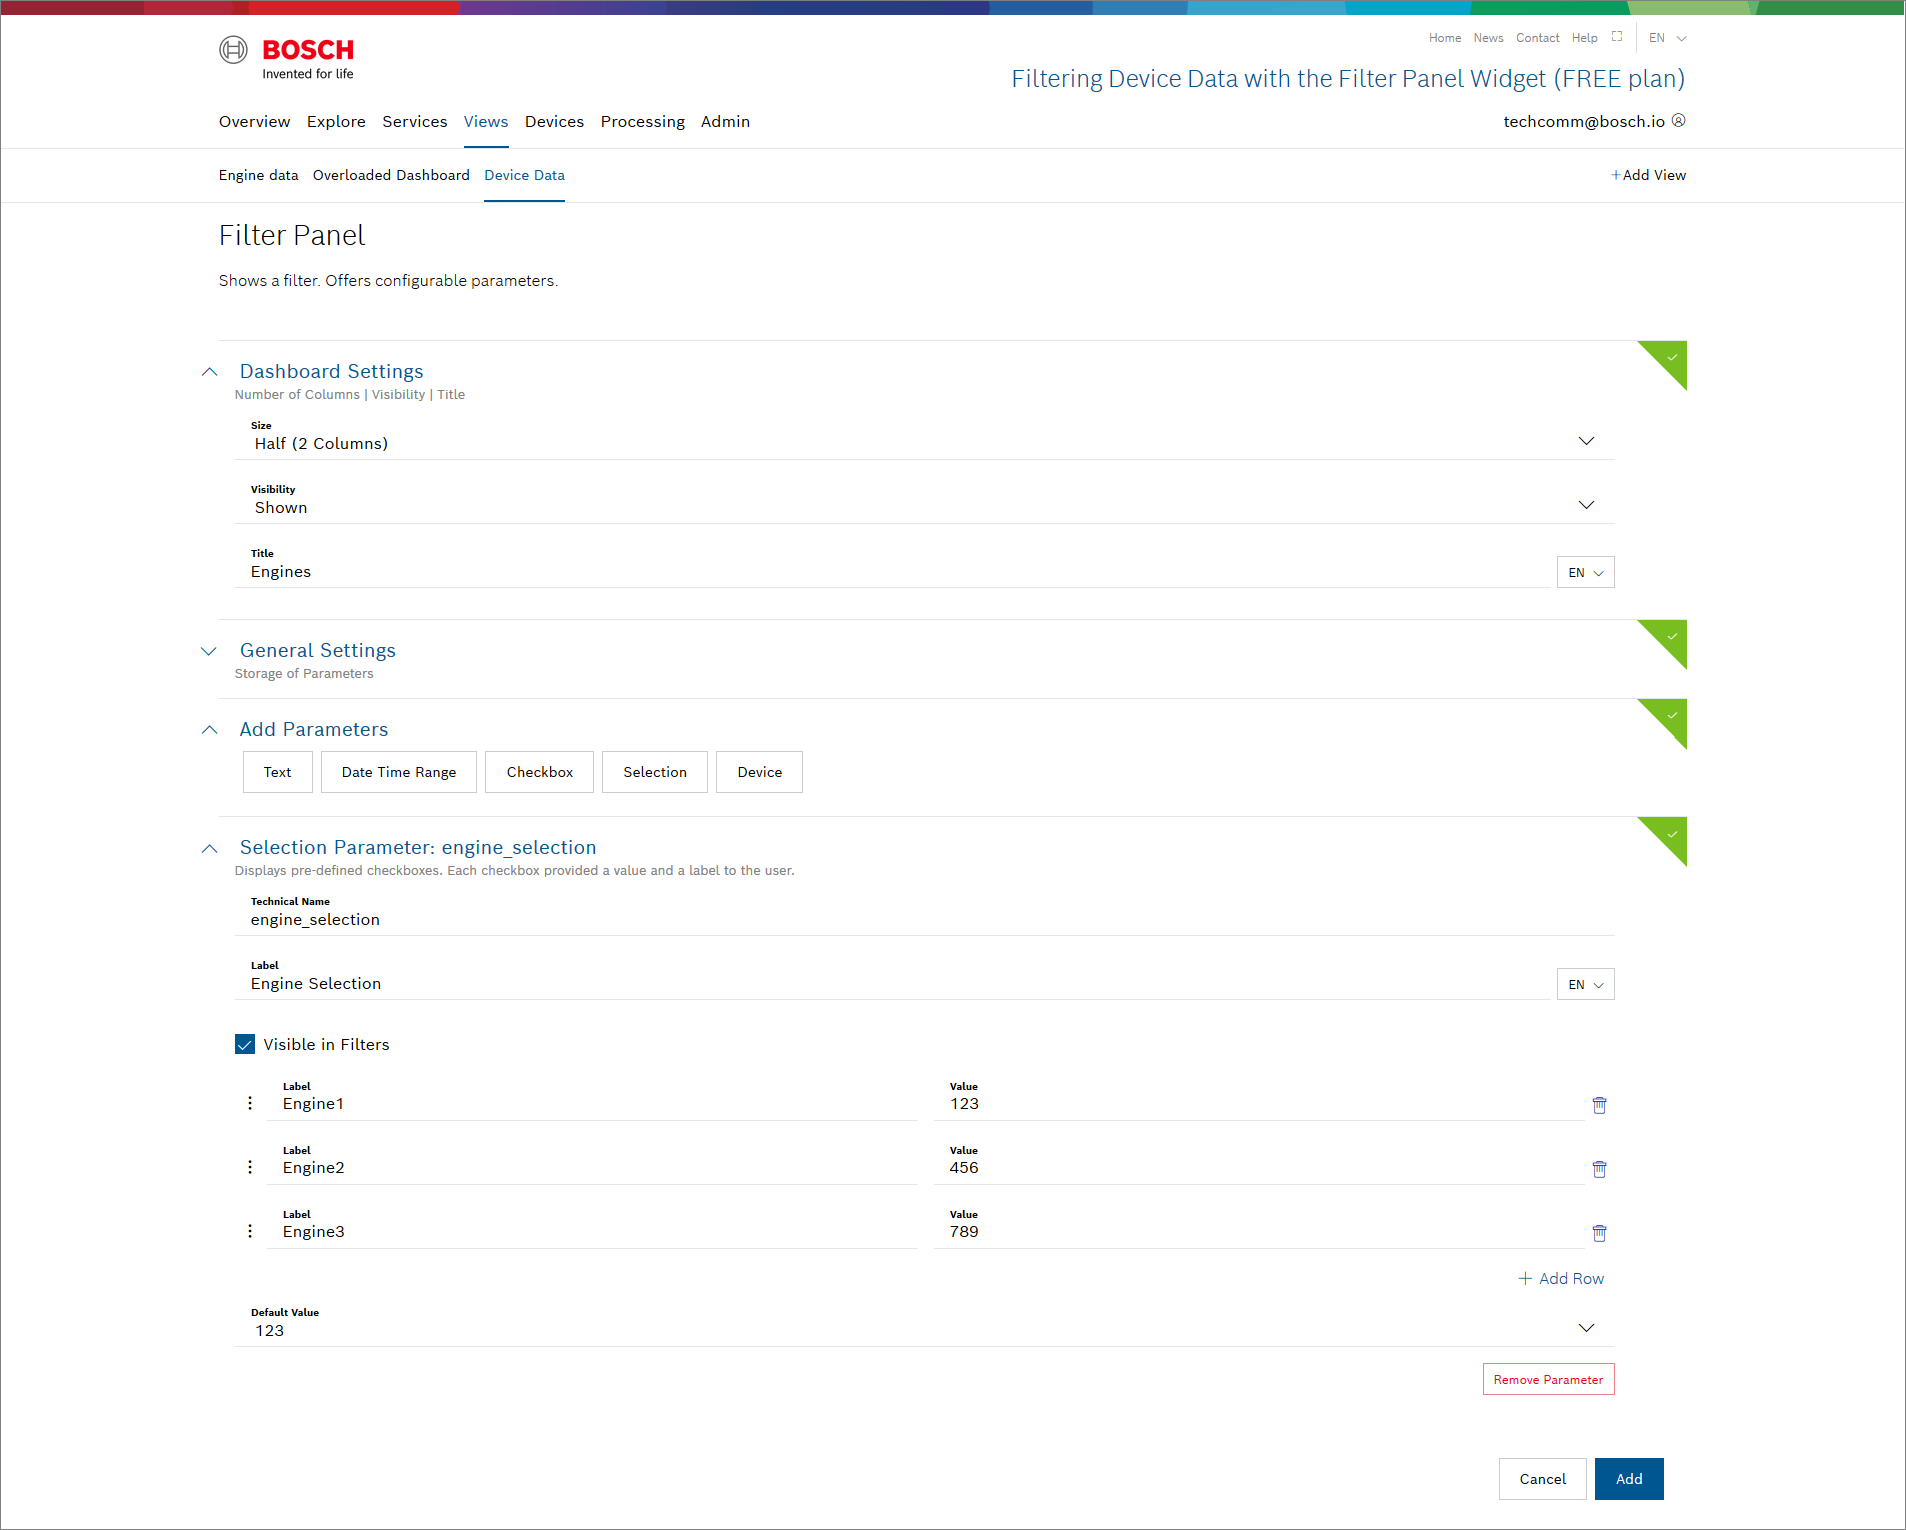
→ The widget configuration page is displayed.Open the Dashboard Settings pane to set how the widget is displayed in the dashboard.
In the Size drop-down list, decide how much space the widget should take in the form of columns.
In the Title field, enter a title for the widget.
Open the Add Parameters pane to select a filter option.
Select the Selection parameter.
→ The Selection Parameter pane is added.
Open the Selection Parameter pane to further configure the filter.
In the Technical Name field, enter the technical name for the parameter.
In the Label field, enter the label that will be displayed in the Filter.
In the Label-Value fields, enter the name of the engine as well as the engine ID.
Click the Add Row button to add rows for the other two engines.
In the Default Value drop-down list, select an engine that shall always be displayed by default.
Click the Add button.
→ The Filter widget is added to the dashboard and shows the filter possibilities in a drop-down list.
Select any engine in the drop-down list and click the Submit button. You will notice that the values in the Value widget stay the same. In the next step, we will link the two widgets with each other.
The Filter widget for this tutorial has been configured as follows:
Connecting the Filter widget with the Value widget
To have the two widgets interact with each other, we need to adjust the data source of the Value widget.
Proceed as follows
In your dashboard, click the Activate Editing button to activate the edit mode.
Double-click the widget to also activate the edit mode.
→ When hovering over the widgets, a frame is displayed around each widget.
In the upper right corner, click the Edit icon
 of the widget that shall be edited.
→ The configuration page of the widget is displayed.Open the Data Sources pane.
In the Parameters section next to the engine_id parameter, click the Reference icon
 .
.
→ The Available References from Filter Widget are displayed.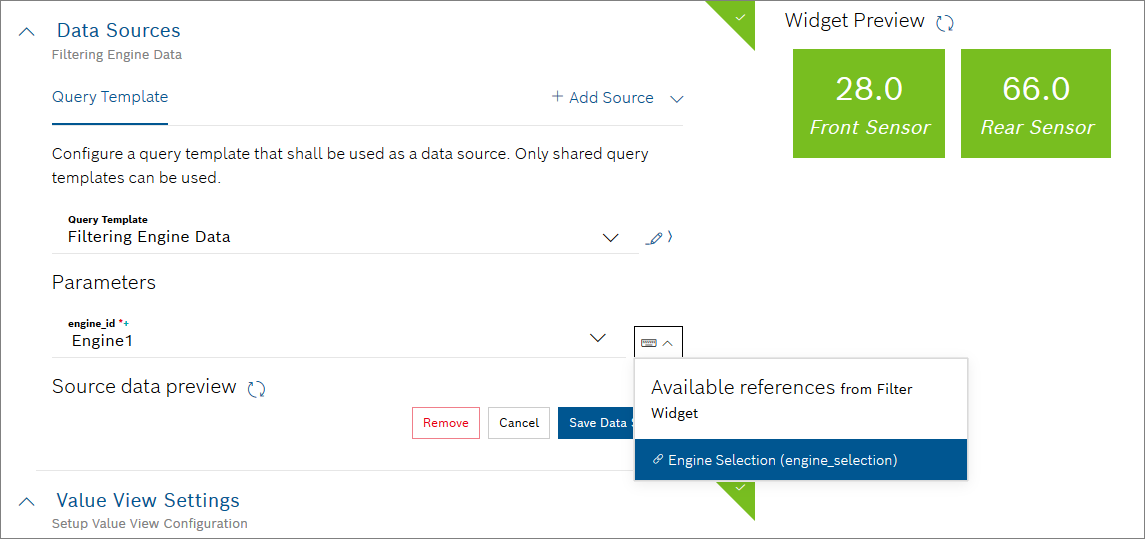
Select the filter we just created.
Click the Save Data Source button.
Click the Save button to save the change.
Filtering the Temperature Values
The temperature values of all engines can now be displayed in the Value widget with the help of the Filter widget.
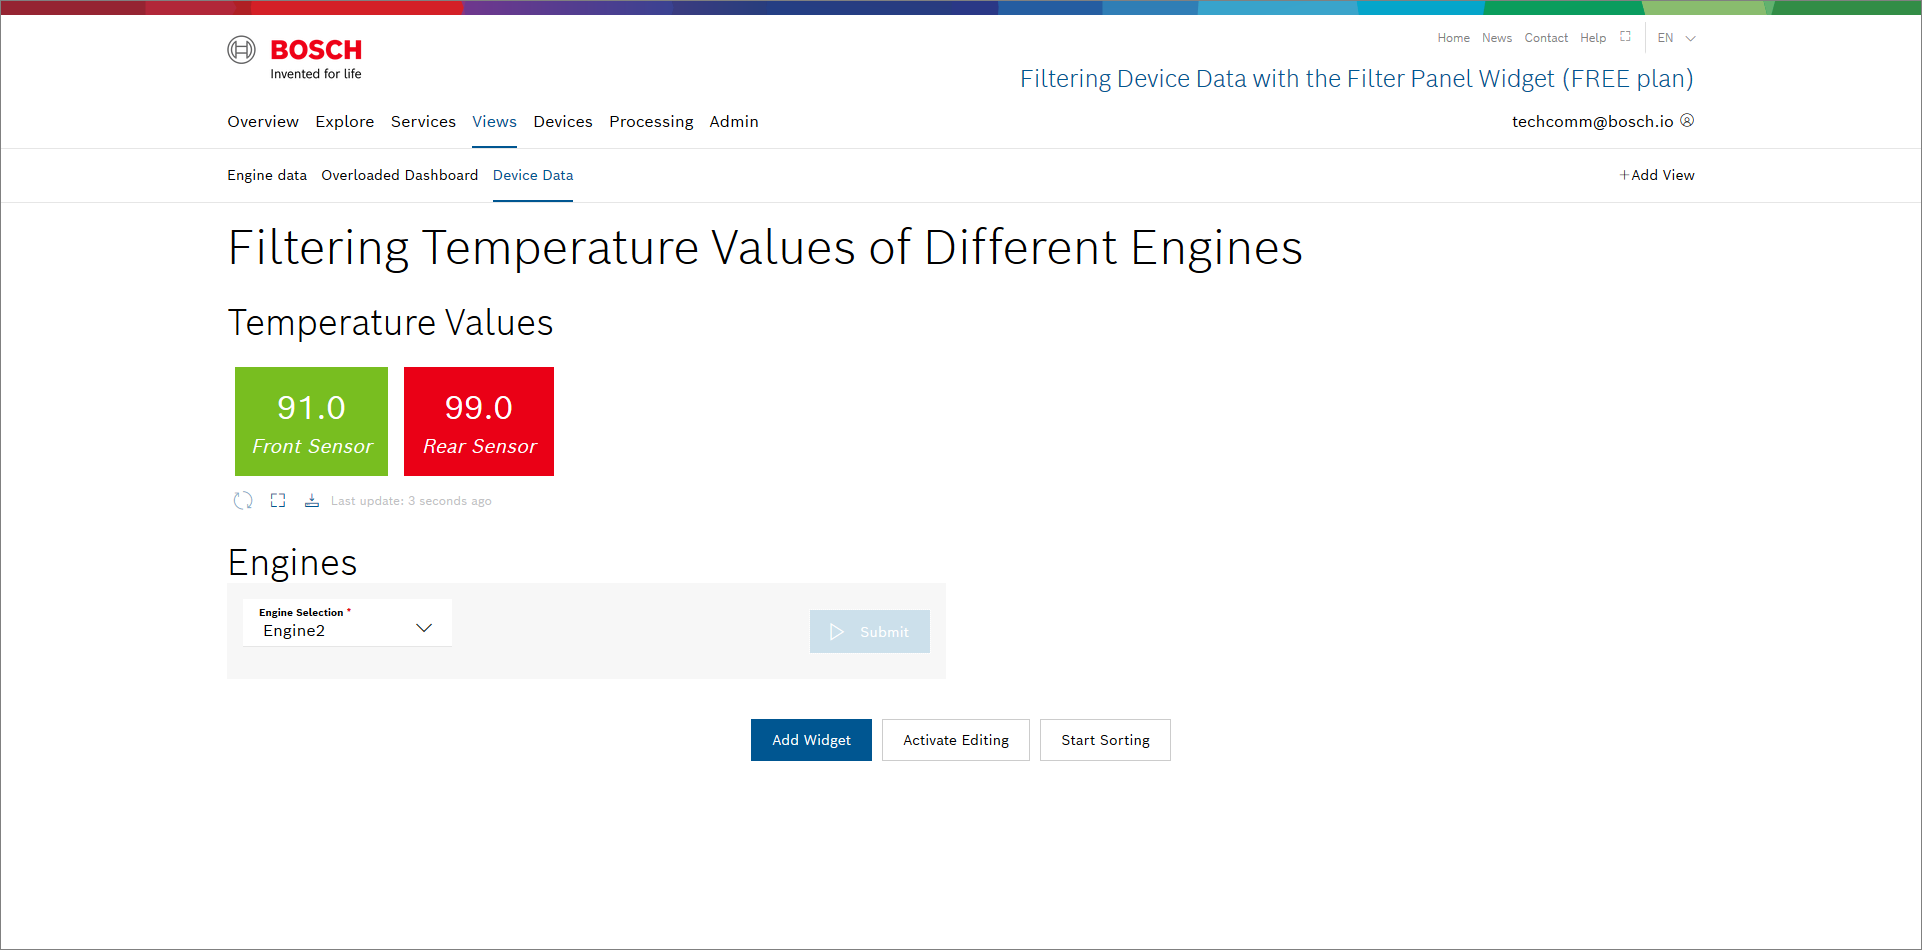
Proceed as follows
In the drop-down list, select any engine for which you want to display the temperature values of the front and rear sensor.
Click the Submit button.
→ The temperature values of the selected engine are displayed.Repeat step 1 to display the temperature values of the other two engines.