Using a custom endpoint to display data in Microsoft Excel
In Bosch IoT Insights, custom endpoints can be configured in query templates to display the data in other data management tools.
Custom endpoints are user-defined REST endpoint paths which trigger the execution of a query template. With these endpoints your own industry-specific tools and standards are supported with Bosch IoT Insights. The HTTP REST request with paths like this https://bosch-iot-insights.com/r/<projectName>/geo/mountain/{continent}/{minHeight}/{maxHeight} can be called and used to pull the data into your tool.
In this tutorial, we will display the temperature values of the front and rear sensors of an engine in Microsoft Excel.
For more information on custom endpoints, refer to the following chapter:
Prerequisites
You need to have an API user with the User user role to execute the custom endpoint.
The content of the Using a custom endpoint to display data in Microsoft Excel tutorial is also available as a video here.

This chapter details the following topics:
Creating the query template
As the first step, the query template needs to be created and the custom endpoint configured.
Proceed as follows
Open the Explore > Data Explorer tab.
Click the Add Query Template button to create a new query template.
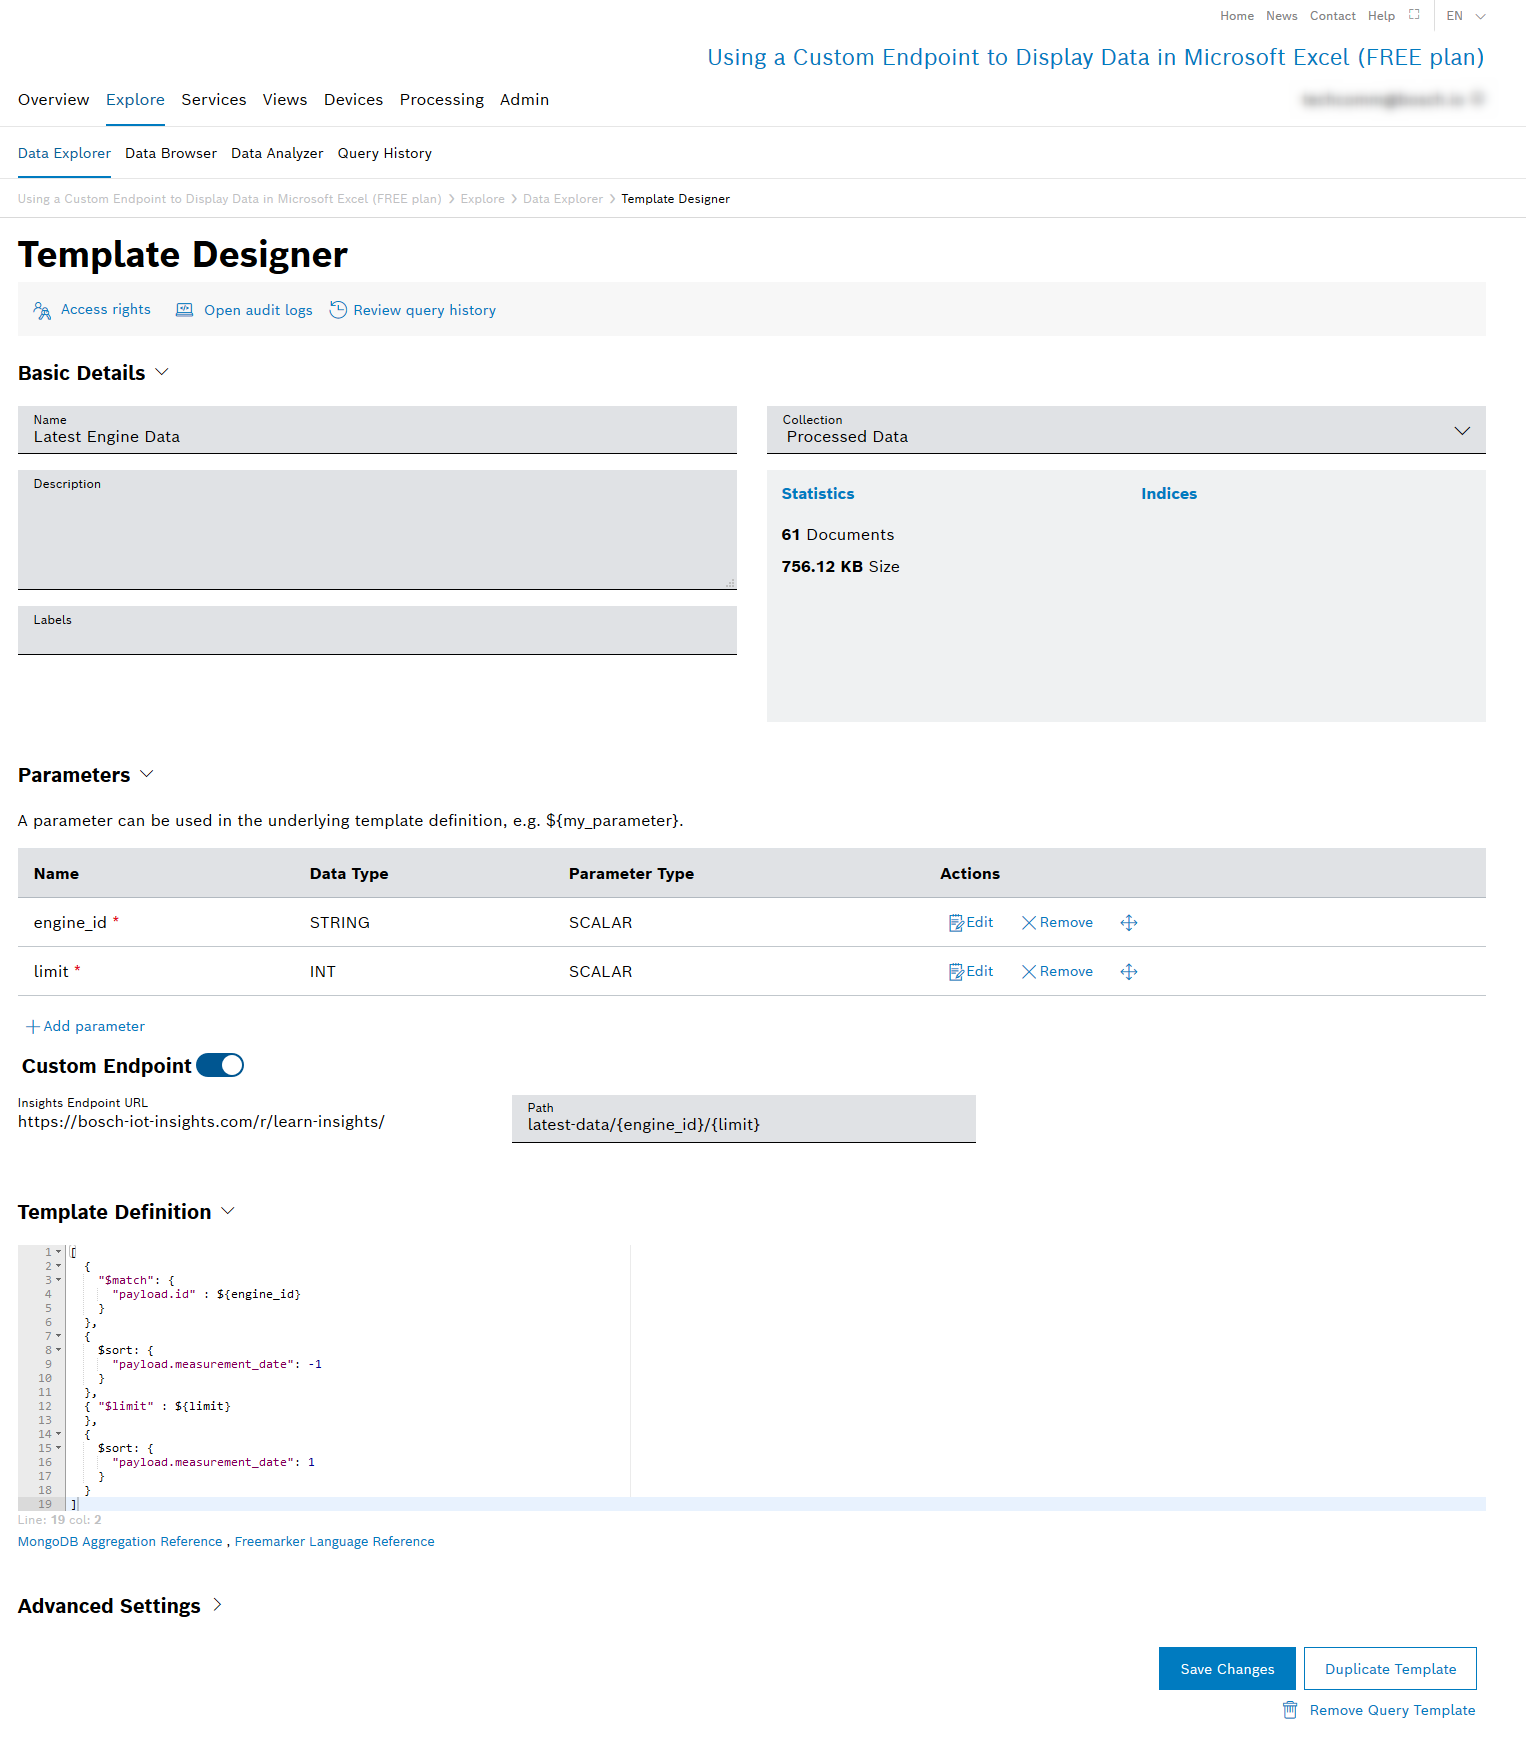
→ The Template Designer is displayed.In the Name field, enter a name for the query template.
Click the Access rights button to define the access rights for the desired user roles. Refer to the Managing query template access rights chapter.
In the Parameters pane, click the Add parameter button to add the first parameter.
→ The Edit Parameter dialog is displayed.In the Technical Name field, enter engine_id.
Activate the Provide Choices checkbox to add the engine IDs and their labels.
Click the Add choice button to add a row for each engine.
Enter a Label and the engine IDs.
In the engine_id field below the Define Default Value checkbox, select the engine that should be set as default engine.
Click the Save button.
Click the Add parameter button to add the second parameter.
→ The Edit Parameter dialog is displayed.In the Technical Name field, enter limit.
In the Data type drop-down list, select INT.
Optionally, activate the Define Default Value checkbox and enter any number for the limit.
Click the Save button.
In the Custom Endpoint pane, activate the Enable custom endpoint switch to execute the query template by calling the customized URL.
In the Path field, enter any unique string and the technical names of the parameters in curly brackets separated by slashes, e.g.
https://bosch-iot-insights.com/r/<projectName>/latest-data/{engine_id}/{limit}
In the Template Definition pane, enter the following query.
[{"$match": {"payload.id": ${engine_id}}},{$sort: {"payload.measurement_date": -1}},{"$limit": ${limit}},{$sort: {"payload.measurement_date":1}}]Click the Create New Query Template button.
→ The template has been created.Test-run the query template with any engine by clicking the Run button to check whether the query template is working correctly.
The query template for this tutorial has been configured as follows:
Accessing the custom endpoint
To test the custom endpoint, the endpoint URL can be called with any web browser.
Proceed as follows
Copy the Insights Endpoint URL and paste it into the address bar.
Copy the Path and paste it into the address bar behind the Insights endpoint URL.
Replace the parameters {engine_id} and {limit} with actual values, e.g.
https://bosch-iot-insights.com/r/<projectName>/latest-data/123/12
→ 12 entries for the engine with the engine ID 123 should be displayed.
Displaying the engine data in Microsoft Excel
In this step, we will load the engine data into Microsoft Excel and create a line chart that displays the temperature values of both sensors.
Proceed as follows
Open Microsoft Excel.
Open the Data tab.
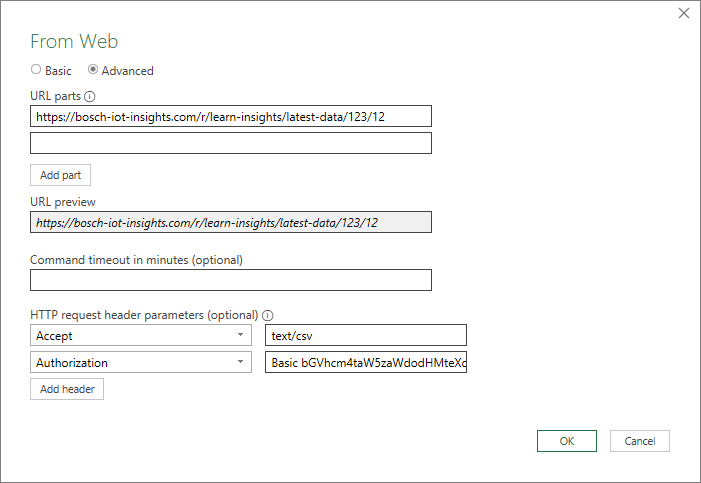
Click the From Web button.
→ The From Web dialog is displayed.Select the Advanced radio button.
In the URL parts field, enter the URL you just pasted into the address bar of your web browser.
In the HTTP request header parameters (optional) pane, add the following headers:
Accept → text/csv
Authorization → Basic <your base64-encoded API user credentials>
For the creation and role adjustment of an API user, refer to Creating an API user.
Click the OK button to save your input and load the data.
→ A dialog is displayed that shows the data to be loaded into the sheet.Click the Load button.
→ The data is loaded into the sheet.
If you are experiencing connection issues in Microsoft Excel, ensure that the anonymous access is set for the URL in the data source settings. We recommend using Microsoft Excel 2013 or Microsoft Excel 365. The issue could not be solved in Microsoft Excel 2016.
To create a chart from the data we loaded from Bosch IoT Insights, refer to the Microsoft Excel documentation.
The From Web dialog in Microsoft Excel is provided with the following input:
Creating an API user
An API user is required to authorize in Microsoft Excel. This API user must have the User role.
Proceed as follows
Open the Admin > Users tab.
Click the Create API user button to add an API user.
→ The credentials are displayed in the Create API User dialog.The dialog provides the credentials for the API user to log in on API level. It is highly recommended to take a note of the credentials as they cannot be read out again.
Click the Edit icon
 in the line of the created API user.
→ The Edit User dialog is displayed.In the Assign roles pane, activate the user checkbox.
Click the Save button.
→ The API user is assigned to the User role.
Refreshing the engine data in Microsoft Excel
If new data is constantly coming in, you can refresh the data in Microsoft Excel.
Proceed as follows
Open the Data tab.
Click the Refresh All button.
→ The data is updated.